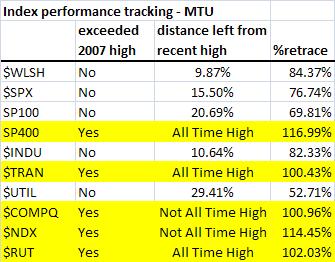
Chart 1 updates the table in Unfinished Business 2011 (4/8/11). This past week saw the DJ transportation average and the Nasdaq composite index recover above their respective 2007 highs, following the lead of the RUT, MID and NDX in early April. Moreover, transports made a new all time high.
We now have 7 major indexes that have recovered their loss from the 2007 top. Short of declaring a new multi-year bull market, this development appears to support A Potential x Wave (2/4/11).
In addition, SPX has finally broke above a decade-long resistance zone discussed in Decision Point (4/21/11) and in prior discussions (Chart 2). This zone is now likely to act as support. It should be noted that while this decade-long price zone appears significant with respect to SPX, similar structures are not present in many of the other benchmark indexes.

Near term outlook
Near term concerns highlighted in Decision Point (4/21/11) appear to be largely behind us. Odds favor a continued rally to complete a five wave advance from the March low (Chart 3, blue), short term consolidation notwithstanding.
The competing bearish count (Chart 3, red) has the market completing wave B of an incomplete correction since the February high.
Chart 4 and Chart 5 offer squiggle counts based on these top tracking counts.


Top calling
 If one disregards the relative size of the corrections since the July 2010 low for a moment, one can count a nearly complete 7 wave advance which potentially completes an ABCXABC structure. Chart 6 presents this (highly?) speculative count.
Note that this count allows the top to be already in place, or developing into an EDT, or developing as a regular five. A major deficiency in this count is that the connecting wave X is undesirably small. It appears to be a lower probability but interesting count to monitor.
A potential EDT in ES
For the very near term, there's a potential ending diagonal triangle developing in the SPX emini (ES) going into the weekend. If so, the initial downside target (or support) is around 1352 (Chart 7 and Chart 8) . The proposed retrace would be wave (iv) of [iii]-up since the March low based on the bullish count. There's further downside potential should any of the highlighted bearish counts plays out.

