The recent rebound pushed S&P400 index and Russell 2000 index above their respective 2007 peaks and to all time highs. The Nasdaq 100 index exceeded its 2007 top a few months ago but is still meaningfully below its 2000 peak. In addition, DJ transportation average and the Nasdaq composite index have now retraced more than 95% of their post-2007 crash. See Chart 1.
We now have 5 major indexes either above or poised to reclaim their 2007 peaks. Short of declaring a new multi-year bull market, this development appears to support A Potential x Wave (2/4/11).


The fresh all time high in $RUT (Chart 2) is worth noting. Its potential long term implications are discussed in detail in Dip or Top (1/28/11).
Near term outlook
 As Chart 3 shows, four major indexes (INDU, SP400, TRAN, RUT) have successfully reclaimed their February highs. The rebound highs to date in another four indexes (WLSH, SP500, SP100, COMPQ) are less than 1% shy of their February highs. NDX and the utility average have been lagging somewhat. Odds favor the February high to be exceeded in most, if not all, indexes - it could happen soon if the rebound is an impulse wave or it could take some time if the recent rebound is an [x] wave (see below).
For the near term, the market is at an interesting juncture as a number of scenarios await confirmation (Chart 4).
 (Green) The preferred count is that the sideways correction this week is wave [iv] of an impulse wave advance since the March low.
(Blue) If the current rebound is wave [x], part of a larger correction since the February high, wave [x] likely has ended. It is easier to see this interpretation in mid and small cap cash indexes as well as SP500 futures. For example, it is possible to count a completed zigzag in ES futures (Chart 5). In an environment where a disproportionate fraction of the net advance is due to overnight pump, the wave structure in futures cannot be discounted.
 (Red) It may be possible to squeeze in a completed five wave advance in SPX and INDU. But this is not a preferred count given the wave structure in futures and in mid and small cap indexes. But this interpretation does introduce the possibility of a truncation or an extension where the current weakness is a 2nd wave pullback.
Chart 6 and Chart 7 show how each of the above scenarios can fit into the larger count.


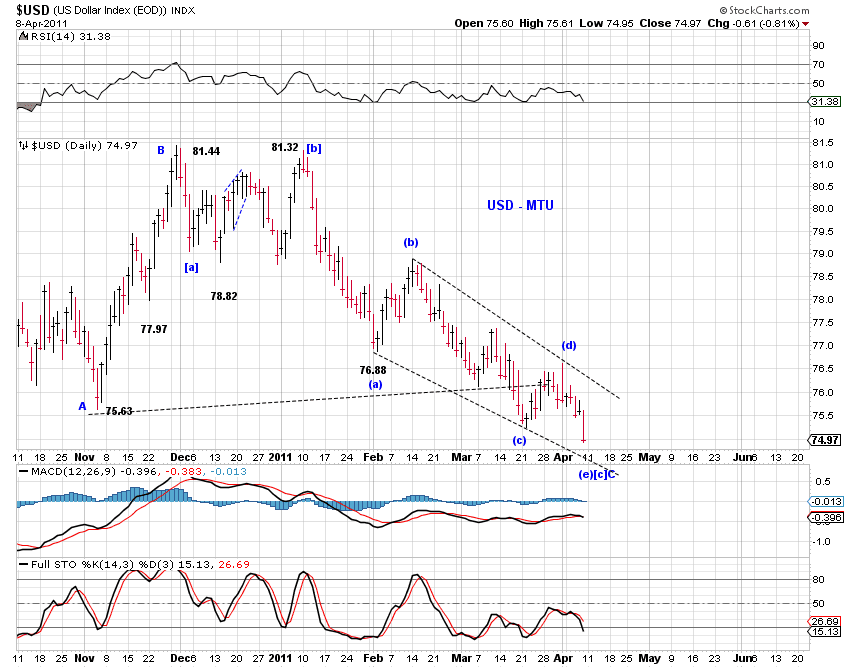
USD index revisited
Please see the USD index section of The Larger Count (3/25/11) for a detailed discussion. With a fresh low in DX, the alternative count presented there could be playing out. " But the message regarding the larger picture remains the same." Chart 8 and Chart 9 below update the recent price actions.
If the USD index fell below its 2009 low, the blue count in Chart 8 would be the "only" scenario that can accommodate a long term bullish count.