Monday, August 18, 2014

Market Timing Update (8/18/14)

[EOD] Stocks -
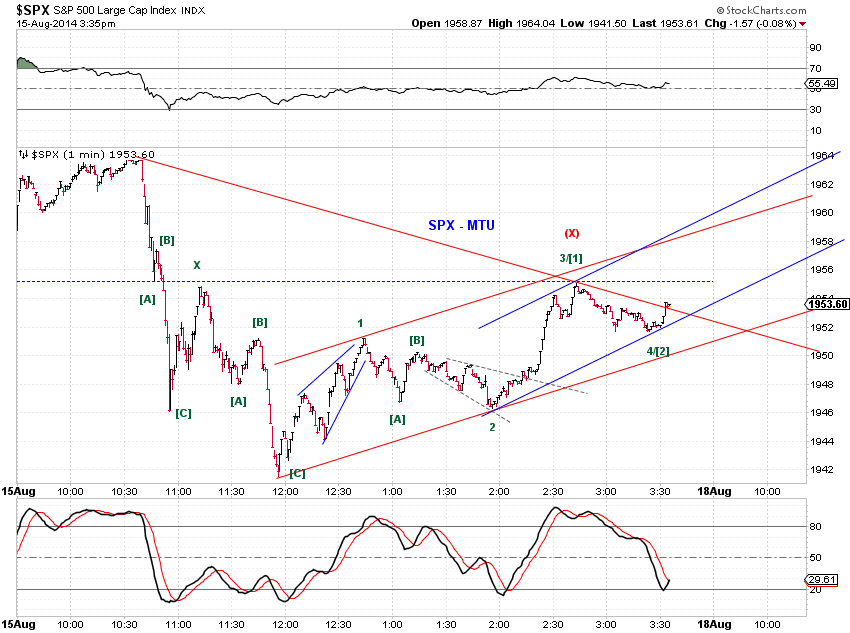
SPX regained 50DMA, filled the middle gap,continued to subdivide higher without overlap since the first pullback. See chart 1. Nasdaq indexes are at fresh 2014 highs.

Price actions present two potential interesting wedges.
The first wedge starts at the August low and ends near current rebound high, counts as C(X) or a full wave v (truncated) or [i] of wave v.
The second wedge starts at the first major pullback of the rebound and ends this week, counts as wave [C]*-up of 2/B-up as marked. If an overnight/AM drop is absent, the proposed wedge becomes a regular small-degree five wave.

Tomorrow presents a potential time window for a pullback/high. Let's see if the market takes the opportunity.


[1145am] SPX update -
SPX fills the second gap as expected. Tracking counts in Chart 1 and tracking squiggles in Chart 2.


[910am] ES/NQ update -
NQ exceeded its July high and is at a fresh 2014 high. 

Mid-gap fill at 1965.14 today is likely, given the overnight upswing in futures and a potential gap open in cash. See Tracking the Rebound (8/15/14) for details.

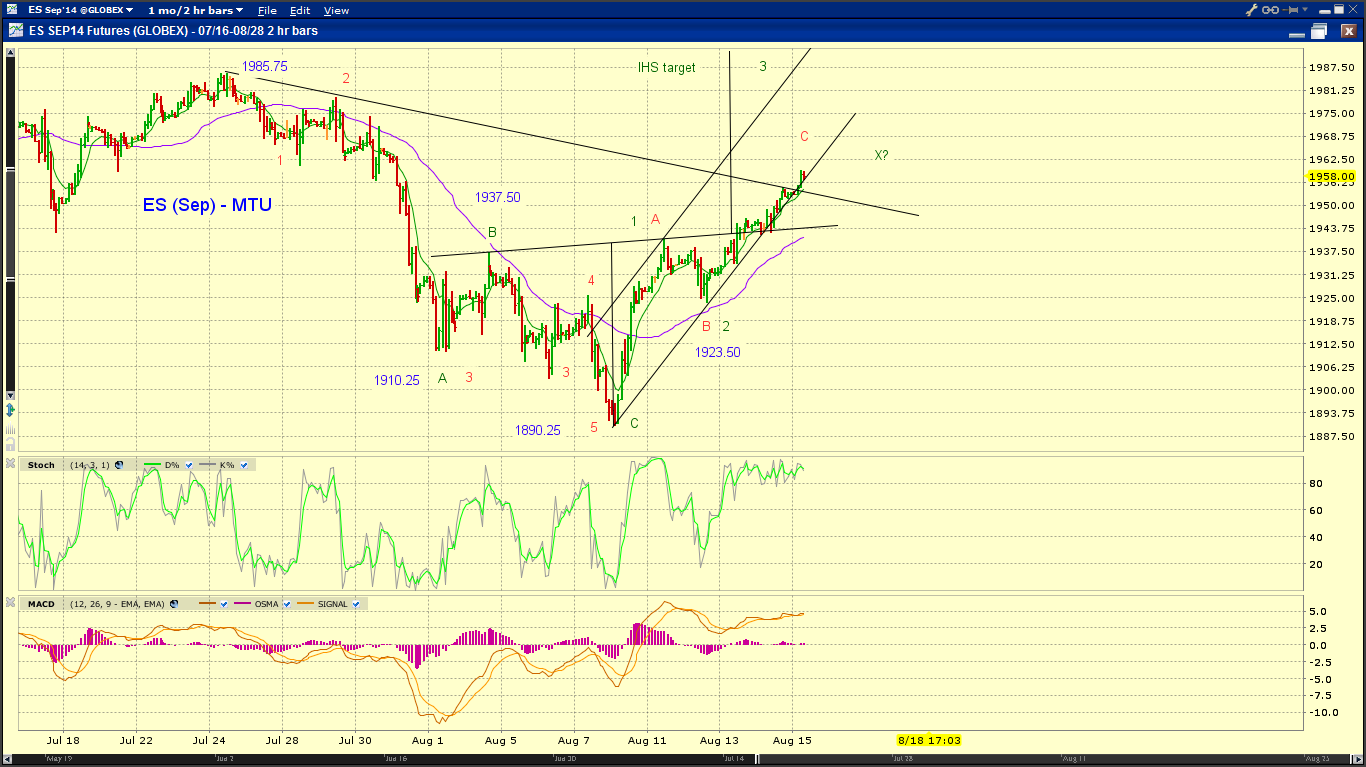
At the same time, ES is wedging at two wave degrees, and NQ looks to complete a larger five wave advance and is also approaching its IHS target.

Upward breakout is necessary for extension potential. Otherwise, at least a retrace is likely See charts.

If an LDT or EDT from the August low in ES/SPX is playing out, the overhead cap is about 1975 in ES and 1978 in SPX cash.


Saturday, August 16, 2014

MTU Weekend Ed. - Tracking the Rebound (8/15/14)

SP500 rebounded and filled the nearest gap around 1935 as expected. Friday saw a swift 20-point drop from the rebound high of 1964.04 and the subsequent intraday recovery reached a 0.618-Fib retrace of the drop. What are the chances that the rebound from the early August low is over?

On balance, odds appear to favor a fill of the middle gap (1965.14) – whether immediate or delayed – given the strength in the Nasdaq indexes, technical upside potential in SPX, and a potential rebound in the German DAX.

Here are some details.

*** Friday's intraday sell-off
Friday’s intraday reversal was as much technically driven as news driven, if not more. Therefore, it’s also prudent to put rebound-stopping fundamentals into a proper technical perspective.

Friday’s high of 1964.04 missed the middle gap (1965.14) by a single index point. It may reflect the waning strength of the rebound and/or strong sell orders at technical levels. To wit, Friday high was 5.7 points above the Fib. 0.618 retrace level of the prior sell-off. Friday’s reversal also took place where SPX kissed a key trend line through the Feb-Apr lows. See Chart 1 where the larger tracking counts remain unchanged.

However, the wave structure of Friday’s intraday reversal is ambiguous. A break of the 20-point range is necessary for resolution. Chart 2 illustrates.
[green-bullish] a double zigzag or a zigzag with a triangle mid-wave from the nominal high to the nominal low
[blue-bullish] a zigzag to the orthodox low with a lengthy triangle mid-wave
[red-bearish] an initial decline followed by an upward expanded flat rebound to the 0.618 Fib retrace level.


*** Tracking the rebound in SP500
Chart 3 updates the key rebound scenarios discussed in Rebound, Gap Fill (8/8/14). We make the following observations.

[red 2/B] If the rebound is the red wave 2, it should ideally have ended at Friday’s high given that NDX was effectively at the prior high. (Chart 4).  Under this interpretation, one expects an immediate sell-off, with the possibility of a waterfall decline.

[green truncated fifth wave OR blue (X)] The rebound could be a diagonal triangle. From a bullish perspective, it could be the entire bullish fifth wave (where NDX makes a new high but SPX fails) OR wave one of an extended fifth wave. From a bearish perspective, it counts as wave C-up of wave (X)-up.  In this case, the middle gap should be filled but to be followed by at least a quick pullback shortly after. 

[green] A series of 1s and 2s which describes an extended fifth wave to new highs.


*** A potential rebound in German DAX
Despite the technical damages recent sell-off in German DAX has inflicted (such as a fresh 2014 low, a breach of both the 50- and 200-day moving averages, and DAX barely defending the 9000 level), a rebound may be coming soon or is already in progress based on its short term wave structure (Chart 5).


[blue] A five-wave drop, where wave four is a skewed triangle, ended in early August.  The proposed rebound is in progress.  Friday's high touched the 0.382-Fib retrace level.  The rebound likely has more upside potential to north of 9500.

[red] A five-wave decline from the high is still in progress. Friday's high is wave (iv) (or wave iv of (iii)).  Further subdivision lower is necessary before a meaningful rebound would materialize.  With wave (iii) already extended, wave iv/(iv) and v/(v) are likely a broad retest of the 8900 zone.  An interesting scenario is a truncated fifth wave based on wave one-five equality as indicated by the green arrow.

Chart 6 updates the bullish DAX/RUT count discussed in Rebound, Gap Fill (8/8/14).


Friday, August 15, 2014

Market Timing Update (8/15/14)

[335pm] SPX update -
 Neckline dynamics (Chart 1) and Squiggles for consideration for your weekend positioning (Chart 2).

[1110am] SPX update -
SPX just retested the potential neckline (Chart 1). So far holding and let's see if it holds. Chart 2 tracks the squiggles from the low. Unless the rebound ended at this morning's high (Chart 1 red), with the middle gap still unfilled, the blue wedge (X or failed 5th wave) is an interesting scenario to entertain.

[740am] NQ/ES update -
NQ is within points of a new high (Chart 1). ES breaks above the trend line associated with a prior base channel - let's see if it holds (Chart 2). If so, SPX cash is likely to fill the middle downward gap around 1965. At the same time, the rebound has left open 2 (3 including the one today) unfilled upward gaps on anintra-day basis.


Thursday, August 14, 2014

Market Timing Update (8/14/14)

[130pm] SPX/NDX update -
Eying the 0.618-fib retrace and second gap fill on the upside (green) AND the completion of a double zigzag rebound on the downside (red). NDX has effectively filled its gap but is also kissing its breakdown trend line. See charts.


[9am] ES/NQ update -
Chart 1 tracks a visual three wave rebound in ES, with various near term options. The wave structure of NQ is interesting (Chart 2).


Wednesday, August 13, 2014

Market Timing Update (8/13/14)

[EOD] Stocks -
Chart 1 tracks the squiggles and Chart 2 tracks the larger count. It is possible to fit a (strange looking) five wave advance (blue count) to today's high (or a minor higher high) in SPX cash (but not ES) - for the moment, the blue upward expanded flat (C(X)) remains on the table.

[1250pm] SPX update -
Squiggles.


[735am] ES update -
Top scenarios to watch (a) gap and go wave 3/C (b) another pullback to around 1920ES (wave [c]-down of 2/B).


Tuesday, August 12, 2014

Market Timing Update (8/12/13)

[EOD]Stocks-
Today's decline fills yesterday's upward gap. The decline, if complete, counts as a double zigzag, if incomplete, counts as an incomplete zigzag or more. See charts.

[850am] ES update - 
Chart 1 shows the larger degree tracking counts. Because of the overnight waves at the low, it is possible to count a five-up in ES (and three+ up in SPX cash)(Chart 2). Potential support levels are around 1920, 1910 on a retrace. See charts.