For U.S. stocks, a fourth wave correction (with ambiguous degree, see below) or an outright trend change is likely in progress. Please also see discussions in
Shift (3/23/12) and
Outlook (3/29/12).
Based on the working assumption that the Hope Rally is a cycle-degree b wave advance,
Chart 1 illustrates where the market likely stands.
(blue) A fourth wave correction with respect to either the November 2011 low or the October 2011 low is in progress, to be followed by higher highs (
Chart 2). Cycle wave b-up will be over when the Hope Rally completes a simple zigzag.
(green) A fourth wave, wave (D) correction within an ending diagonal triangle (EDT) dating back to the 2010 low. Note that the EDT is largely driven by quantitative easing (QE) and has a tendency to loose steam around the end of each QE episode. If so, another round of stimulus is likely to accompany a wave (E) overthrow.
(red) A double zigzag completes the cycle wave b advance at the recent high. A trend change or a cycle wave c decline is underway.


Odds favor the fourth wave interpretation as long as SP500 does not meaningfully breach its decade-long support/resistance zone (
Chart 3).
At the moment, a potential retest of the breakout is in progress. The bearish count would be significantly strengthened if we have a false breakout with support around 1300 failing.
For the near term, the proposed fourth wave correction could take up more time and price range. See
Chart 4.


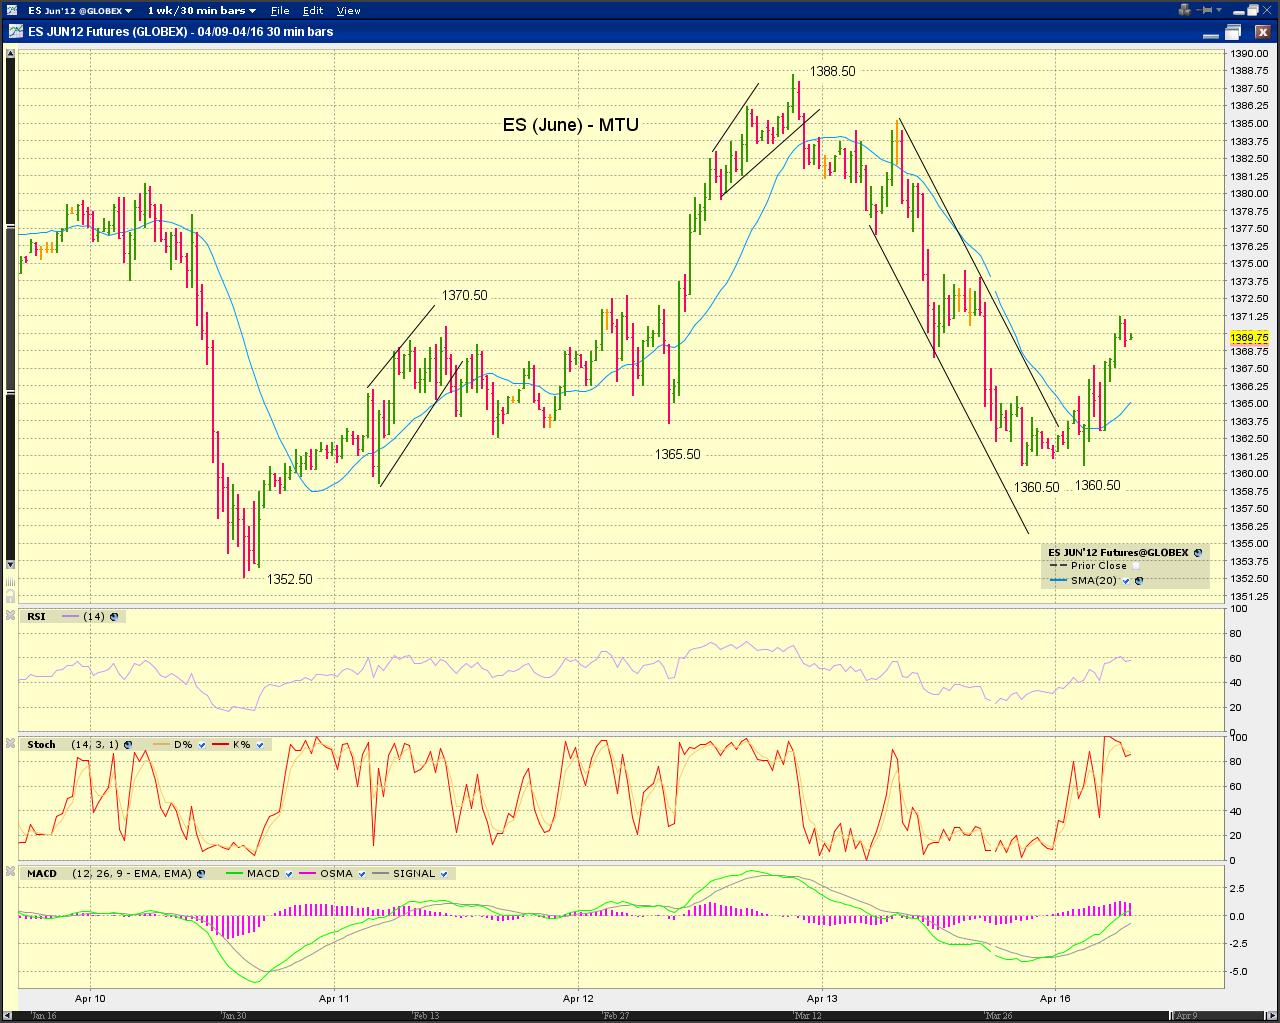
 Zigzag advance from today's low at the moment. On the bullish side, it could be the start of C-up of an upward flat (blue) or something more bullish (green). On the bearish side, leave room for an expanding EDT 5th wave (purple [v], red C) or LDT (red [i] or [i]/[ii]/(i)/(ii)).




 SPX is at around 50% retrace of the decline from the nominal high and has entered the prior breakdown zone and is facing near term resistance.


