Saturday, January 15, 2022

MTU Weekend Ed - Wedge Details and Morphing (1/14/22 close)

In out 1/7/22 close update - 

"In the context of a triple zigzag - see last weekend's update on the longer term structure -  there are now enough structure for a high, but also room for further more development, including a potential EDT from the October low in SPX. "

As of 1/14/22 close - 

Chart 1 updates details on a potential EDT from the October low in SPX.  Internal structure of the A of the wedge is ambiguous, which raises questions about the validity of an EDT.   The Dow made a lower low for the month this past week and SPX did not. Chart 1 also shows the invalidation and upside levels.

If the wedge gets invalidated,  a major high could be in (at the red H) in the context of a triple zigzag.  

Chart 2 updates the triple zigzag. 

Note that this triple zigzag has room to extend in time and price.  It's possible that the second (X) is not the October 2021 low [blue (X)] but a potential low in Feb/Mar 2022 [green (X) potentially testing SMA200]. In that scenario, SPX could be in the middle of this flat-like (or even triangle) structure.


Sunday, January 9, 2022

MTU Weekend Ed. - A final wedge? (1/7/22 close)

In the context of a triple zigzag - see last weekend's update on the longer term structure -  there are now enough structure for a high, but also room for further more development, including a potential EDT from the October low in SPX. 


Sunday, January 2, 2022

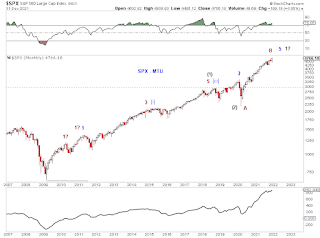
MTU Weekend Ed. - Wish You a Safe 2022 (12/31/21 close)

 Three visual possibilities for the large structure from the 2009 low.

But it is not easy to track an impulse from the 2020 low. 


Sunday, December 26, 2021

MTU Weekend Ed. - Filtered (12/23/21 close)

The added price bars of the past week now have filtered our three tracking counts down to one, the triple zig-zag. 


Friday, December 17, 2021

MTU Weekend Ed. - Room for Santa Rally (12/17/21)

Previous tracking scenarios are unchanged. 

Chart 1 - The red and blue tracking counts anticipates a Santa Rally. 

Chart 2 - The most bearish count is the one where the green (B) is the blue Y - the top.


Sunday, December 5, 2021

MTU Weekend Ed. - 50-DMA

We commented in the Nov 21 post (as of Nov 19 close) about "a possible high or  small-degree wave-two or wave-B retrace with MA50 as a potential floor." in SPX. And now the SPX is at its MA50 (and the Dow its MA200). 

While a (truncated) high (at the red 5) remains a possibility,  the subsequent decline looks more like a corrective wave (a double zigzag) than a impulse wave (an incomplete leading diagonal), and favors a wave-B (or X) or a wave-Two.  The following chart updates where we are in terms of these three possibilities.