Monday, June 8, 2015

Market Timing Update (6/8/15)

[EOD] Stocks -
Stocks are wrapping up some unfinished business today, as discussed in Rally Next ? (6/5/15). See charts.

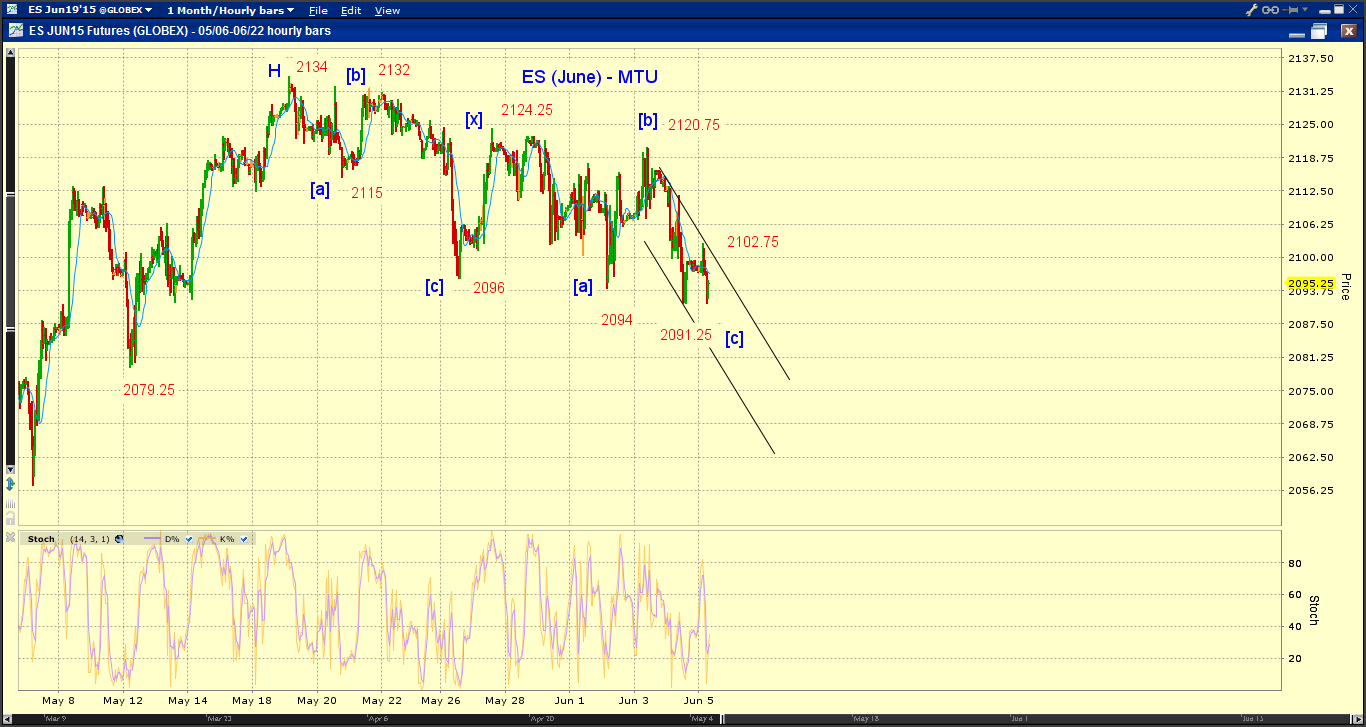
[745am] ES update -
ES potentially wedging. See chart and weekend commentary for more.


Friday, June 5, 2015

MTU Weekend Ed. - Rally Next? (6/5/15)

SP500 may be ready to rally to a potential new high.  But mind the risk. 

Pronounced positive divergence – a 2nd time in 2015
The green lines in Chart 1 show the conspicuous positive divergence between SP500 and its RSI (and MACD too). This is the 2nd such positive divergence in 2015. Following the first such occurrence in January 2015, SP500 rallied 138.69 index points or 7%. (But keep in mind the 1-year-plus negative divergence at a larger degree, see this chart.)


Wave structure
One of our two tracking counts (see Monthly Outlook Update (5/29/15)) shows that SP500 is now at the lower EDT trend line support (Chart 1).

Furthermore, the pullback so far is a three-wave ABC corrective structure. Once it ends (Chart 2, note the potential small-degree unfinished business), the subsequent rally targets the upper EDT trend line, an overthrow and a new high.


That gap in VIX (Chart 3)
is likely to be filled, potentially sooner rather than later.

Mind the RISK
It’s prudent to keep in mind the other tracking count (Chart 4) which tracks the scenario that SP500 has already peaked (see Monthly Outlook Update (5/29/15)).

Market internals are showing more weakness than benchmark indexes.  For example, SP500 AD line has made a lower low on a larger degree (Chart 5 red lines), although a similar negative divergence earlier (Chart 5 red arrows) accompanied a market bottom rather than additional selloff. 


Market Timing Update (6/5/15)

[1005am] SPX update -
SPX has kissed the EDT support and is rebounding. See charts for lines, tracking counts and squiggles.

[840am] ES update -
post-jobs-report probing of the green EDT support. see charts.

[740am] ES update -
Jobs report at 0830 EDT. Overnight probing. See chart.


Thursday, June 4, 2015

Market Timing Update (6/4/15)

[EOD] Stocks -
A low of this complex pullback may be in or is in sight subject to a minor breach/retest. See charts on ES and SPX.

[1220pm] SPX update -
Steady decline to wrap up (d)-down or bearish triangle consolidation as wave b-up of (d)-down. See charts.


[850am] ES update -

Wednesday, June 3, 2015

Market Timing Update (6/3/15)

[EOD] Stocks -

[1025am] SPX update -
Tracking lines, counts, and squiggles. Note the potential expanding triangle overhead. See Chart.

[840am] ES update -


Tuesday, June 2, 2015

Market Timing Update (6/2/15)

[EOD] Stocks -

[1305pm] SPX update -
Also note the potential gray expanding triangle [b] this churning continues for a while. See chart.
[1255pm] SPX update -
Lines, counts, squiggles, and overhead resistance to watch. See charts.

[845am] ES update -
Full moon. ES is likely wrapping up a potential abc-x-abc structure (Chart 1), potentially as the green wave [d] in Chart 2.

Monday, June 1, 2015

Market Timing Update (6/1/15)

[EOD] Stocks -
[705am] ES update -
The first session of the month. ES has been probing the potential support trend line late Friday afternoon and overnight. See Chart. See Monthly Outlook Update (5/29/15) for discussions on the larger count.