stocks, bonds, USD, gold
Stocks
SP500 not only rebounded smartly from its August 7th low of 1904.78 but also advanced to a record high of 2005.04 this past Tuesday.
We track the current advance as wave (v) off the February low (
Chart 1, blue), with an outside chance of it being wave [d]-up of an expanding triangle consolidation (
Chart 1, red).
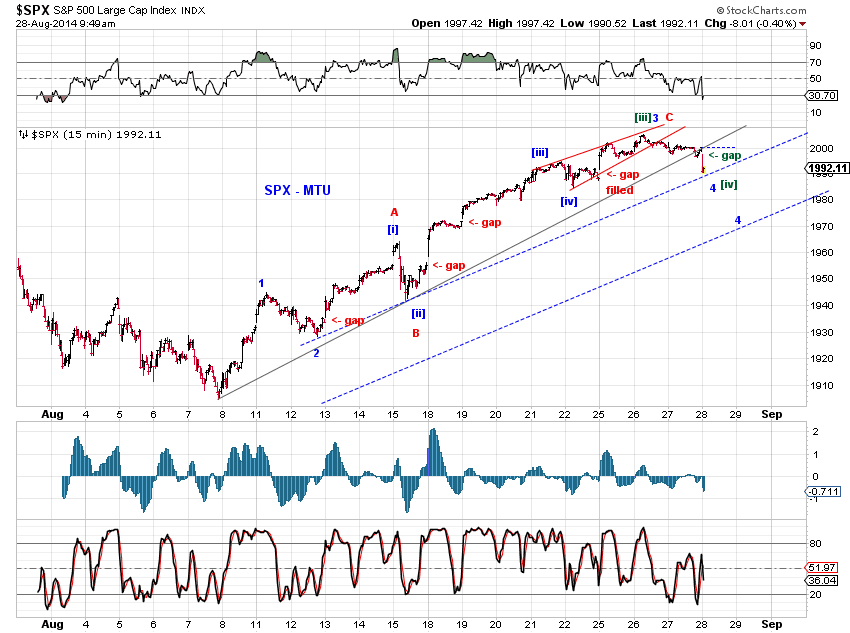
Either way, the advance is mature. Note that the the three unfilled gaps in the current advance is likely to be filled before long.
On the squiggle level, Tuesday’s record high is likely wave iii (or wave [3] of iii) of the proposed impulse wave advance (
Chart 2, green, blue). Barring an expanding triangle consolidation whose wave [e]-down points to the sub-1900 area before another advance to new highs (
Chart 2, red), we wait for various small-degree fourth waves to finish and then wave (v)-up to complete the advance.
At the moment, the wave structure of the current upswing project a wave (v) top around the 2015-2030 area.
Tracking the big picture (as discussed in
Extended Move (8/22/14))
Readers will recall that for some time in the past, we had been tracking the post-2011-low advance in stocks with a triple-three wave structure and had made an unsuccessful attempt at timing the top of that advance based on time equality of each of the three legs.
Chart 3 refreshes our memory where the red [c] represents the timed top. SPX did pullback initially but then rebounded smartly to make successive new all time highs. Price actions since then suggest that this triple-three count may still have merit.
The final wave [c] of Wave E, instead of terminating at the time-equality point, decided to extend into five waves! (
Chart 1) The current upswing is wave (v) of this extended wave [c] under this scenario.
If this scenario tracks, the subsequent sell-off is likely targeting 1550-1750, perhaps 1300-1400 or even more.
It should be noted that this triple-three structure is not the only valid tracking count of the post-2011-low advance, ex ante, but certainly one of the more interesting ones.
Bonds
Long term U.S. Treasury yields are spending time between their long term resistance and the upper EDT support as shown in
Chart 4. Please see discussions in our Monthly Outlook Update over the past few months for details. With the August rally in bonds, 10-year yields are now retesting the green upper EDT support.
One of the two near term scenarios discussed in
Monthly Outlook Update (8/1/14) appears to be tracking.
"[red] The 2014 rally in bonds is a part of an expanded flat consolidation dating back to mid-2013. Expect one more drop in yield to complete wave (c) of the expanded flat, perhaps to fill the gap around the 2.35% area."
The drop in bond yields in August not only traced out wave e-down of (c)-down, but also unequivocally filled the gap around the 2.35% area. See
Chart 5.
The green count in
Chart 5 now tracks a double-three ABC pullback in yields. It's possible that the lower blue trend line of the "base channel" could be tested in this case.
USD
The USD index has enjoyed an impressive run since its May low of 78.93 to Friday’s high of 82.79. As
Chart 6 illustrates, the USD index broke out of an EDT in May at point #1, successfully retested prior resistance at point #2, successfully took out another resistance at point #3 after some consolidation, and rose to complete a visual five-wave advance around point #4.
Once again, the USD index is approaching potential resistance. In addition to the potential pullback following the completion of a five-wave run,
Chart 7 highlights sources of longer term resistance.
The first source of resistance is a potential head-and-shoulders pattern indicated by the red labels. If this HS pattern tracks, the subsequent decline projects to the 73 area.
The second source of resistance is the blue downward trend line which has capped the 2010 and 2013 rally in the USD index. A failure to break above this trend line is likely result in a retest of the lower green trend line support (e.g.
the blue wave (B) in Chart 7). However, a successful breakout introduces substantial upside potential (e.g.
the green wave (C) in Chart 7).
Gold
This coming weekend (Sep 6, 2014) will be the
Fib-3-year anniversary of gold’s record high (Sep 6, 2011).
Gold is likely approaching a major turning point and has the potential to stage an impressive rally. The blue count in
Chart 8 illustrates.
After a 22-month wave (A) sell-off from 9/6/11 to 6/28/13 in the form of a downward flat, wave (B) rebound consumed 2 months till 8/28/13. The wave (C) drop traced out a sideways terminal triangle, which has taken one year to complete.
Recent resilience in gold prices appears to support this bullish scenario. Although gold price dipped below the July low in August, it actually closed slightly up for the month, delivering a black candle. Furthermore, despite the relentless strength in the U.S. dollar in recent weeks, gold price has held up relatively well.
Note that not all scenarios are immediately bullish. In
Chart 8, we are tracking the red and green counts along with the blue count.