The Dow made a fresh recovery high while the rest of leading benchmark indexes lagged by various degrees (
Chart 1). Based on the corrective nature of the pullback from the September highs, those benchmark indexes are likely to catch up with the Dow
in good time. The debate at the moment is whether the pullback from the September high was over or is extending. The direction in which the market breaks out of its Oct 2-5 range (1439.01-1470.96 in SPX) likely determines the relative odds.
Hope Rally "model" update
Based on our Hope Rally “model”, U.S. stocks are around point #5 (
right hand side of Chart 2), which is likely not yet complete.


Well-defined near term risk
The direction in which the market breaks out of its Oct 2-5 range (1439.01-1470.96 in SPX) likely determines the relative odds on whether the correction from the September high is over. In other words, a fall below 1439.01 without first breaking above 1470.96 would favor a continued correction and a breakout above 1470.96 without first breaching 1439.01 would favor a fresh upswing. As noted in recent weekly commentaries, the correction from the September high is best interpreted as a fourth wave, degrees uncertain.
The above conclusion is based on the wave structure since the September high, best illustrated by that in the Dow (
Chart 3).
(bullish - green) A zigzag correction off the orthodox high ended on October 2nd, with a truncated second decline. Wave 1 of a fresh upswing completed at Friday’s high.
(bearish - red) Wave A from the September high to the low on September 28th took the form of a flat. The rebound to Friday’s high is wave B which also took the form of a flat. A wave C decline is in progress.
Larger count update
With respect to the larger count since the June low, a fresh upswing is best counted as [v] of 3-up (
Chart 4, green) while a continued consolidation is best counted as 4-down (
Chart 4, blue)
. A plausible but tail event is that point #5 of our Hope Rally "model" was indeed complete and the correction to point #6 has been in progress along a complex structure (
Chart 4, red).


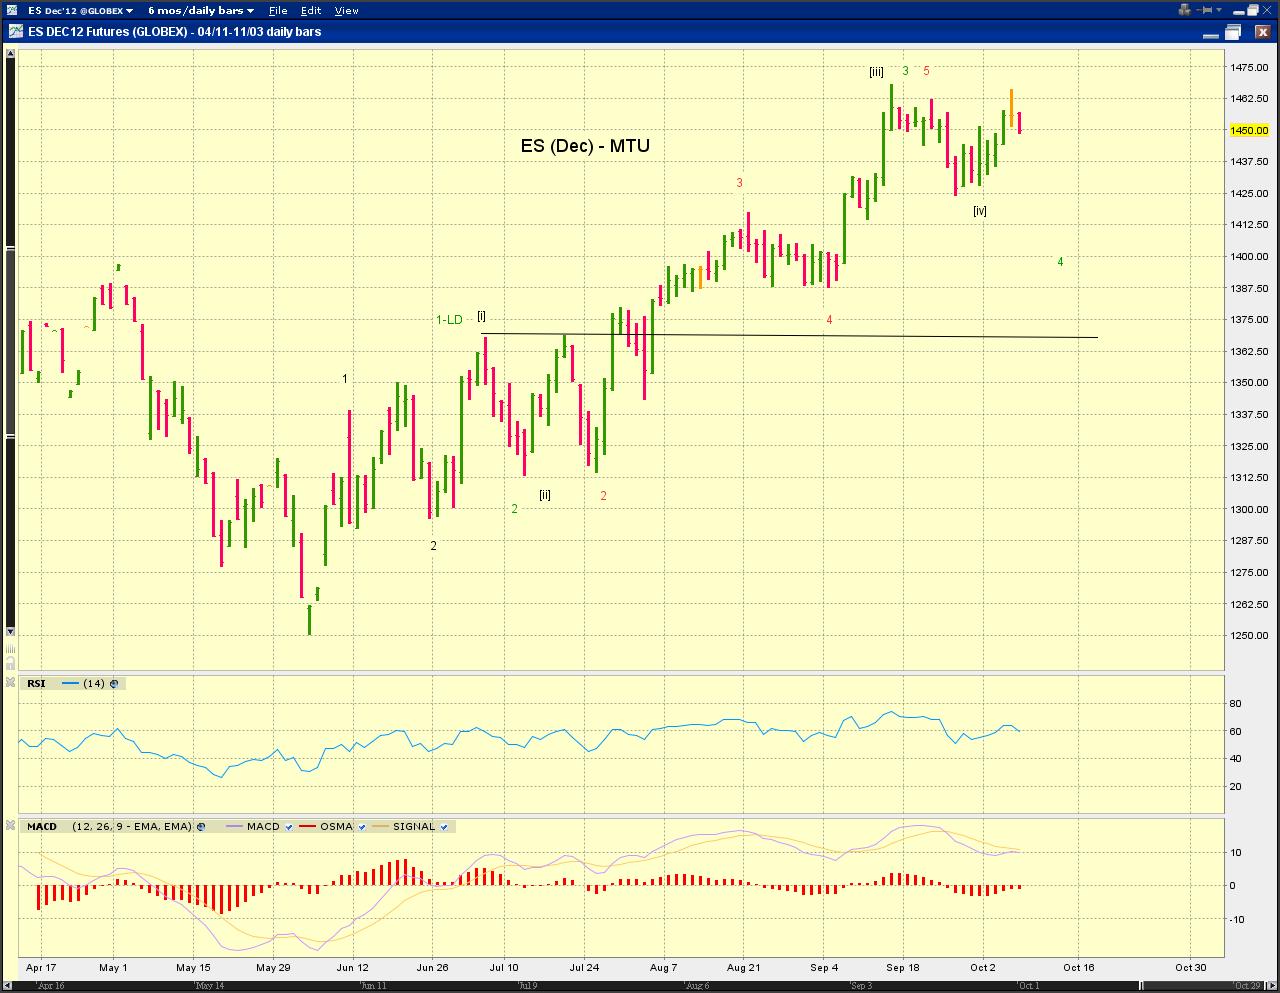


 The wave structure of ES finally cleared up with three tracking counts (Chart 1). Of particular note, given a series of three-wave structures, is a bullish terminal triangle (the green count) or even a regular triangle from the orthodox high. The bearish red count suggests a higher near term high and the bearish black count suggests a near term high is in. Both the red and the blue counts suggest lower lows.


