Thursday, August 16, 2012

Market Timing Update (8/16/12)

[EOD] Stocks -
Key tracking counts are crystallizing nicely. See also the 110pm entry.


[110 pm]SPX update -
For those who are looking for a terminal count, here is a legitimate one. Chart 1 presents the squiggle count which corresponds to the blue count in Chart 2 discussed in recent days.


[740 am] ES update -


Wednesday, August 15, 2012

Market Timing Update (8/15/12)

[EOD] Stocks -
The top near term options are updated in Chart 1 and discussed/explained in yesterday's EOD update.
I mentioned yesterday that subjectively speaking, the gray and green counts are appealing. Today's price action increased the odds of the blue expanding EDT-up and decreased the gray expanded flat-down, while prospects of the green count continue to be favorable. Under these interpretation, the associate invalidating pivots are well defined. In addition, the 1391/1392 area ideally should remain intact for the bulls.

[830 am] ES update -
ES at near term trend line support. Near term options vary (see yesterday's EOD update). It's probable that the proposed wave (4) is still finishing.


Tuesday, August 14, 2012

Market Timing Update (8/14/12)

[EOD] Stocks -
Chart 1 shows the wave structure of the current advance which is challenging the 2012 high in SPX. Chart 2 shows the top near term options.


[green] The proposed wave (5) is extending, with 3/4/5 to come.
[blue] The proposed wave (5) is an expanding EDT (see trend lines) or extending in a 1/2/[i]/[ii] fashion.

[gray] Bullish expanded flat correction which will frustrate both bulls and bears. [c]-down to come. This is the green count in Chart 1.
[red (5) following green (4)] The blue 3 or red [c] of Chart 1 topped today. This appears to be less likely as the final wave [v] is very small.

Subjectively speaking, the gray and green counts are appealing.


As discussed in the 2pm entry  below, the proposed wave (5) is capped at 1448.11, and likely at 1428.06 - unless the gray count plays out.

[2pm] SPX update -
Don't know if the proposed wave (5) is done, an EDT (see chart) or will extend at the moment. But note that the proposed wave (3) is smaller than wave (1), so the proposed wave (5) is capped at 1448.11 (with a more probable cap around 1428.06).


[710am] ES update -
ES is challenging its 2012 high. The pullback since 4am EST counts as a small-degree 4th wave at the moment. Alternatives are D/4-down of an EDT (red trend lines) or start of c-down of an expanded flat (green).


Monday, August 13, 2012

Market Timing Update (8/13/12)

[EOD] Stocks -
The bullish continuation pattern has survived so far, failure of which would imply an initial target around 1380, bullish extension otherwise.


[750 am] ES update-
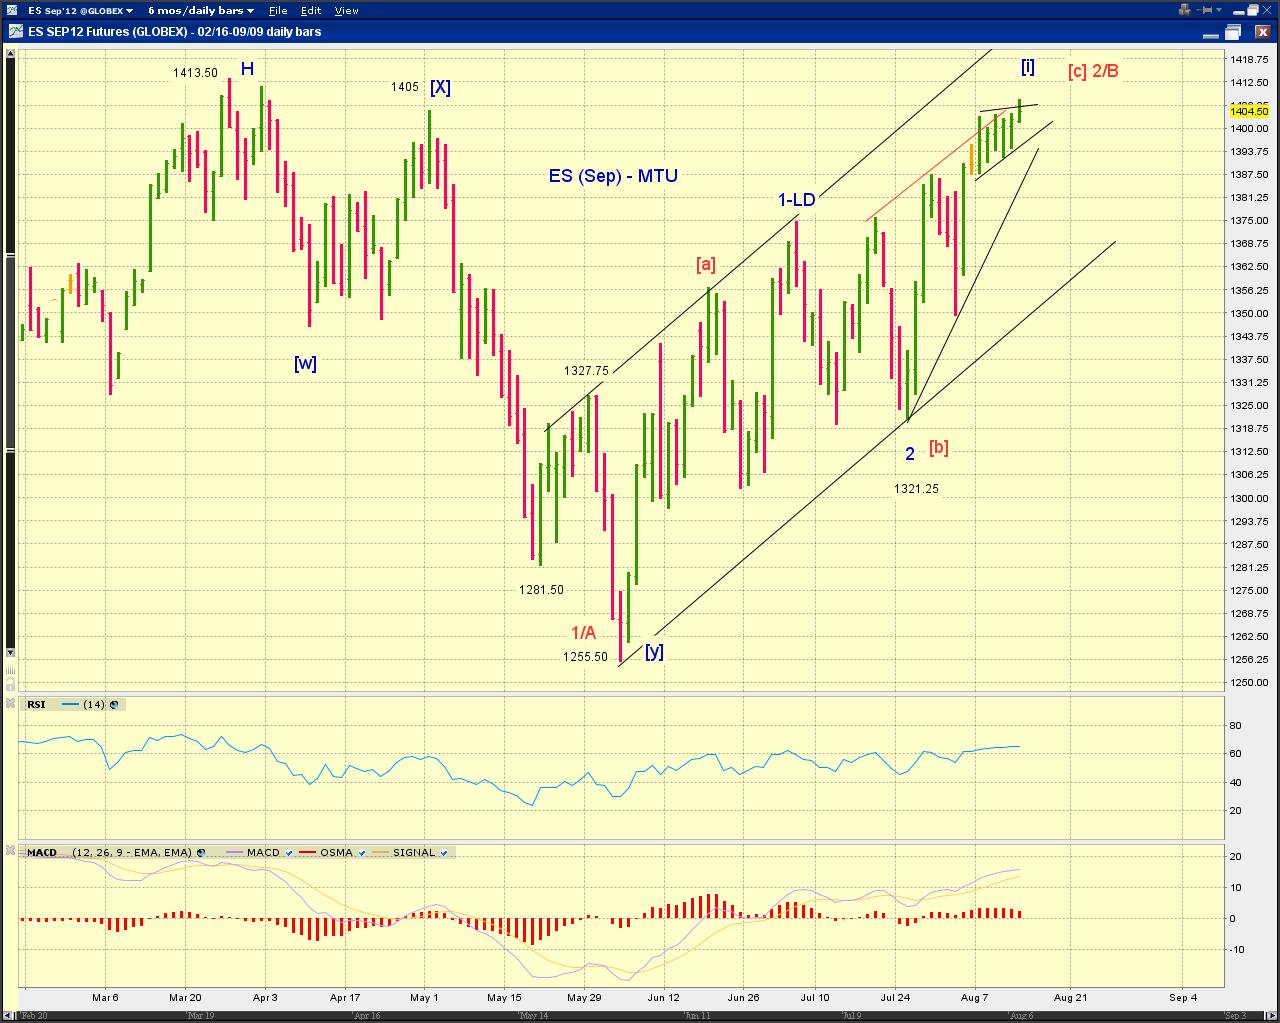
ES is approaching its May high of 1405. The rally since the June low has 11 visual waves so far which implies a bearish triple zigzag or bullish 1/2/[i]/[ii] formation (Chart 1). Squiggle level wave structure suggests a near term triangle or wedge on the bullish side (Chart 2 black or red) and a flat correction on the bearish side (Chart 2, green).


Friday, August 10, 2012

MTU Weekend Ed. - Tug of War (8/10/12 Close)


SP500 made fresh recovery highs Monday and Tuesday. That advance was likely the small-degree 5th wave discussed in Moment of Truth (8/3/12). The wave structure since then best counts as a zigzag decline followed by a fresh impulse higher (Chart 1, blue). The zigzag decline also served as a retest of potential new support (Chart 2 green trend lines), so far with success.


This development suggests additional bullish extension. But assessing the upside potential has been tricky in recent weeks. The tug-of-war between the bullish count (Chart 2 blue, new 2012 highs) and the bearish count (Chart 2 red, no new 2012 highs) remains. However, as discussed in Breaking (7/27/12), odds favor a breaking of the 2012 range to date.

For the very near term, the immediate bearish count (Chart 1, red) is much less probable but not dead. A forceful small-degree 3rd wave decline (potentially accompanied by a gap down next Monday) would support the bearish count.

In addition, market technical profiles as measured by advance/decline statistics and inter-market relative strength have improved but negative divergences remain (Chart 3). Technical profiles need to strengthen further to be compatible with a sustainable rally.


Market Timing Update (8/10/12)

[735 am] ES update -
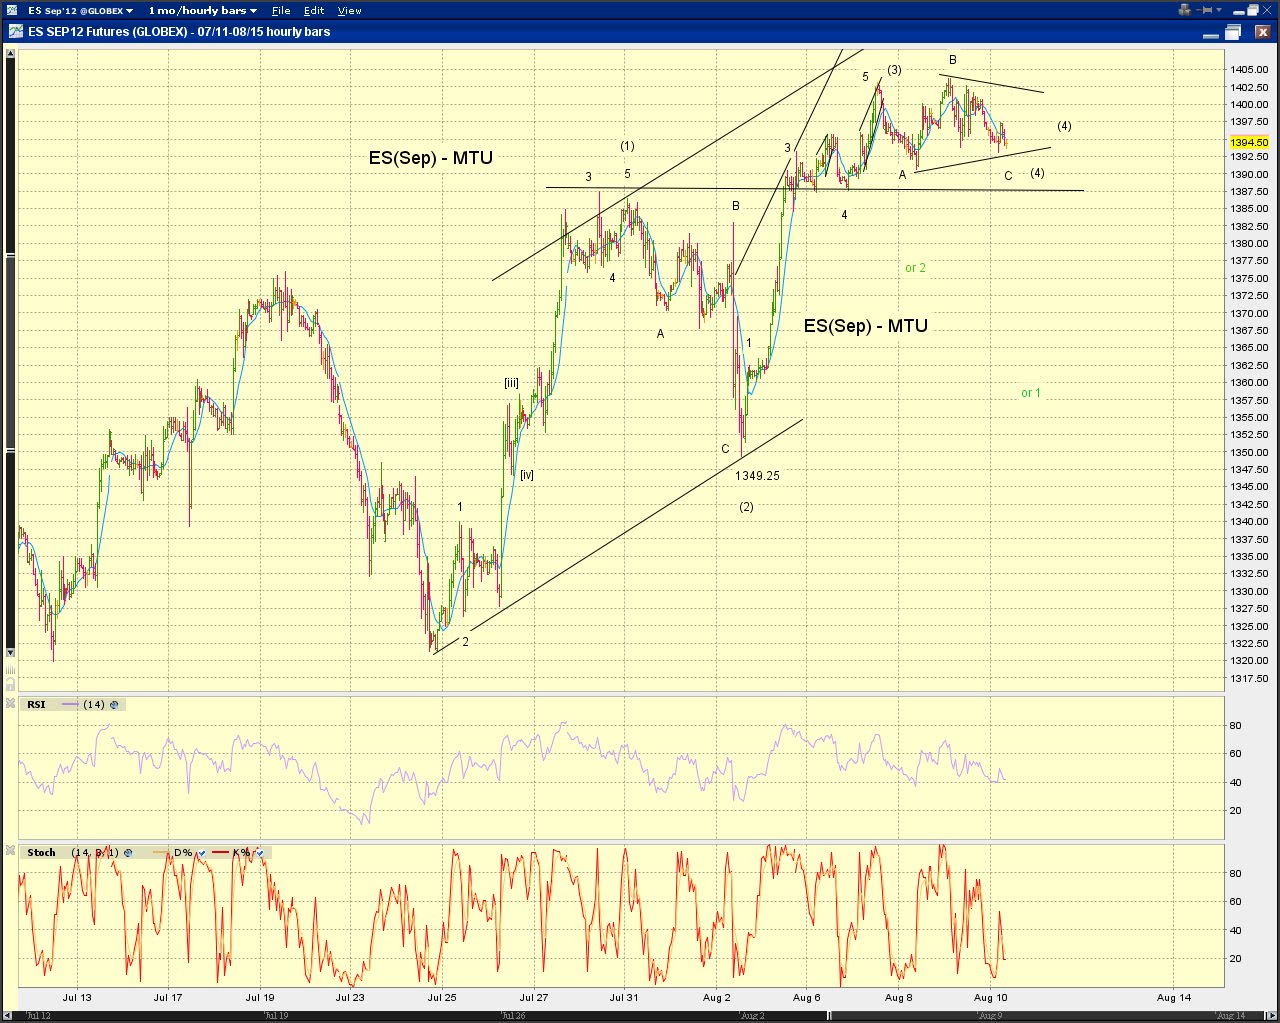
Wave (4) watch is still on. Other options exist. See chart.


Thursday, August 9, 2012

Market Timing Update (8/9/12)

[EOD] Stocks -
The potential triangle/flat is still on the table. See charts.


[1220pm] SPX update -
triangle/flat watch update, see chart


[740am] ES update -
Primary count is a 4th wave as indicated - see chart. Other options exist.