Tuesday, May 8, 2012

Market Timing Update (5/8/12)

[EOD] Stocks -
At today's low, U.S. stocks likely have completed a five wave decline from their May high (which is a recovery high in the Dow). See Chart 1. The current sell-off is either
(1) the initial decline of a larger pullback (B wave or X wave)or an outright trend change on the bearish side, OR
(2) the end of a two-month long correction (wave 4 or wave B)on the bullish side.

Odds appear to favor the bullish interpretation, which has so far retained the "right look" across major benchmarks (Chart 2). In transports, we have what appears to be a lengthy but probably completed triangle wave (X) or wave (4). But in any case, we likely have today's low as a key pivot.


[940am] SPX update -
A well formed five wave decline from the recent high (and recovery high in the Dow). See squiggle and larger tracking counts.


[730am] ES update -


Monday, May 7, 2012

Market Timing Update (5/7/12)

[EOD] Stocks -
A dramatic overnight low in ES was reversed by the cash open, and SPX rebounded at the lower edge of its consolidation range over the past two months.See Consolidation or Topping Process (5/4/12 close) for additional discussion. Chart 1 updates the larger count and Chart 2 offers a squiggle count from the nominal high.  See the [2pm entry] for a squiggle count from today's low.


[2pm] SPX squiggles -
Tracking counts on SPX from today's cash index low. Please see the 2nd chart below
[938am] SPX squiggles -
From the nominal high in May: red - 123 down; blue - ABC down; purple - five down.


[820am] ES/NQ update -
Lower low in ES and DAX. ES is back inside the "channel", and NQ is back-testing the underside of it.


Friday, May 4, 2012

MTU Weekend Ed. - Consolidation or Topping Process (5/4/12 Close)

Major U.S. stock indexes have been range-bound for about two months since their March high (Chart 1).  There has been strong support at the bottom of the range to produce the April double bottom as well as strong resistance at the top of the range to suffocate  a new marginal high in the Dow this week. 

As market sentiment swings accordingly at each end of this price range, the key question of whether the market is in a sideways fourth wave consolidation or a topping process (e.g. the 2011 top) remains to be answered (Chart 2). 

Ironically, the assessment discussed since the March high has not changed.  Odds likely favor a consolidation as long as the breakout above the long term resistance zone (see Chart 1) does not fail.


For the near term, we have some well-defined wave structure in the SP500 Emini since the April low (Chart 3).


Market Timing Update (5/4/12)

[140pm] SPX squiggles -
See the 1105am entry for larger tracking counts.


[1105am] SPX update -
See the 2nd chart below.
[840am] ES update -
ES wave structure from the recent high and after the NFP report.


[730am] DAX, ES update -
Five up and three down.


Thursday, May 3, 2012

Market Timing Update (5/3/12)

[EOD] Stocks -
We have a well formed ABC decline from the recent high at the moment(Chart 1). Chart 2 shows how it fits into the larger count.
P.S. - Added a potential EDT 5th wave (of wave 3 or wave 5 itself) in Chart 2. The potential EDT in SPX looks interesting.

[150pm] SPX update -


[705am] ES update -
As mentioned yesterday, the wave structure in ES is interesting and telling. Note that yesterday's low in ES is around the 0.382 fib retrace and guideline support from a proposed expanded EDT 5th wave. See chart.

Wednesday, May 2, 2012

Market Timing Update (5/2/12)

[EOD] Stocks -
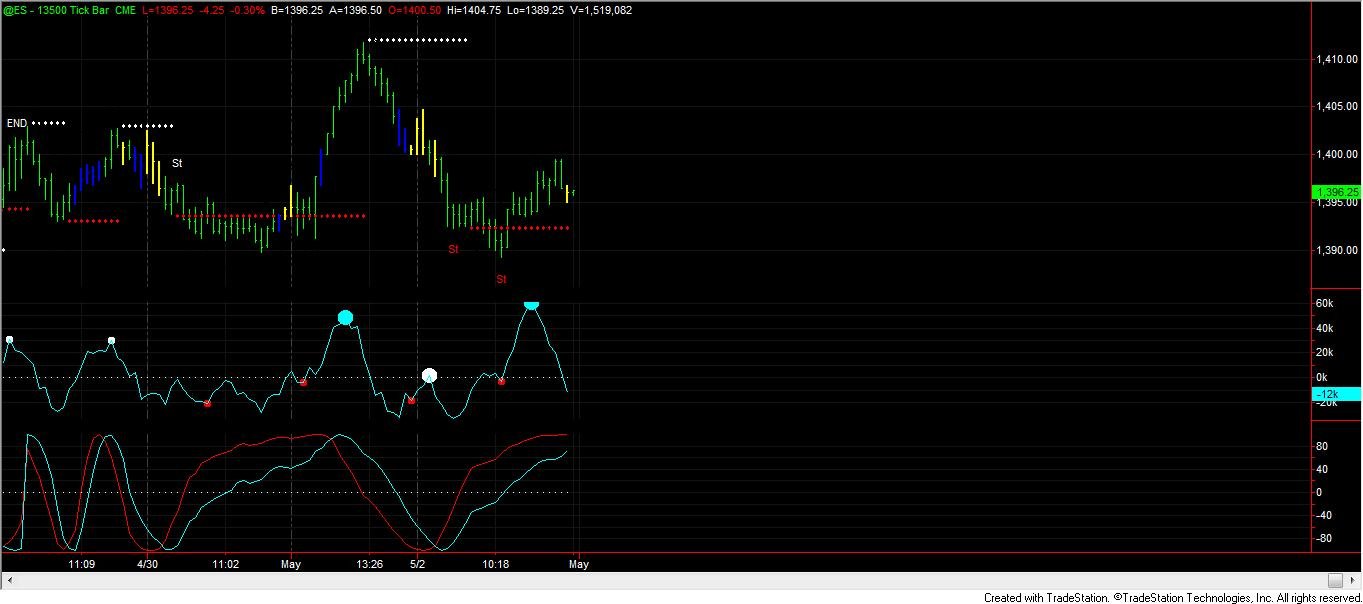
ES has traced out a zizzag decline from yesterday's high to today's low (see Chart 1 under the 1050am entry below). The decline in SPX cash and the ES tick (see this chart by td12 by td12 and his comments below) can potentially be counted as a five.
The rebound from today's low appears corrective so far (unless we have an LD or a nested 1s2s). Thus, odds favor a lower low to come.
Chart 1 shows the larger count and Chart 2 offers a squiggle count on SPX.


[1050am] SPX/ES update -
ES completed a zigzag decline so far (Chart 1). SPX cash did a 0.382 fib retrace (Chart 2). Moment of truth is at hand with this morning's low a key marker for near term direction.


[820am] ES update -
The wave structure in ES is telling.

Tuesday, May 1, 2012

Market Timing Update (5/1/12)

[EOD] Stocks-
Despite the intraday surge, there are meaningful divergences among indexes. It might be premature to eliminate the B-wave count. See intraday entries below for current counts.
[12pm] SPX squiggles -


[1035am] The big picture (SPX, INDU) -


[845am] ES update -
May day.