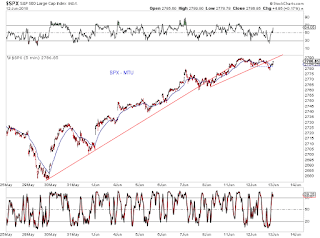
Potential bear flag in SPX, either done or one more high (gray Z)
potential short term upward bias
If so, it could support the small-degree wave 5 in NDX.
Disclaimer: Each post is for informational purposes only. It is not a solicitation, a recommendation or advice to buy or sell any security or investment product. Information provided in each post does not constitute investment advice.
Friday, June 29, 2018
Thursday, June 28, 2018
Market Timing Update (6/28/18)
SPX filled a gap and rebounded. One more lower low (red E in chart 1) would look better for the red (i) in chart 2.
Wednesday, June 27, 2018
Monday, June 25, 2018
Market Timing Update (6/25/18)
SPX filled several gaps as expected. A couple more open below.
At a larger degree, SPX is correcting a potential small-degree DT
NDX is done (red) or has a small-degree wave five to go (blue)
At a larger degree, SPX is correcting a potential small-degree DT
NDX is done (red) or has a small-degree wave five to go (blue)
Saturday, June 23, 2018
Wednesday, June 20, 2018
Tuesday, June 19, 2018
Friday, June 15, 2018
Thursday, June 14, 2018
Tuesday, June 12, 2018
Monday, June 11, 2018
Saturday, June 9, 2018
MTU Weekend Ed - Structure (6/8/18 close)
SPX is approaching the end of a structure. Top possibilities are
[bearish - red] 1or A-down from Jan high, 2 or B-up from Feb low.
The upswing from Feb low is either an EDT (red with cap of 2824.53) or WXY (grey). Once concluded, a downswing to below Feb lows is likely.
[bullish - green] ABC-down from Jan high to Apr low, LDT up from Apr low as 1-up or all of it. Once 1-up concludes, a pullback to 2600 then wave 3-up are likely.
With the lower low in INDU at the Apr low and new highs in RUT etc, a triangle from Jan high in SPX looks less likely than the above scenarios.
Thursday, June 7, 2018
Market Timing Update (6/7/18)
Reaction at parallel channel and diagonal triangle boundary.
ABC down today - a flat or a larger LDT on the bearish side or just a shallow pullback
ABC down today - a flat or a larger LDT on the bearish side or just a shallow pullback
Wednesday, June 6, 2018
Monday, June 4, 2018
Saturday, June 2, 2018
Subscribe to:
Comments (Atom)


