Disclaimer: Each post is for informational purposes only. It is not a solicitation, a recommendation or advice to buy or sell any security or investment product. Information provided in each post does not constitute investment advice.
Saturday, April 29, 2017
Friday, April 28, 2017
Wednesday, April 26, 2017
Tuesday, April 25, 2017
Monday, April 24, 2017
Saturday, April 22, 2017
MTU Weekend Ed. - Week 8 (4/21/17)
The coming week is a Fib-Eighth week of the current stock market decline (Chart 1).
From a bullish perspective, SPX could seek a potential fourth wave low. The case of a fourth wave pullback would be stronger if SPX stays within the current downward channel - the entire pullback would be an A-B-C(triangle)structure.
Although the measured target area would be 2280-2300, a break of the downward channel presents potential for a larger decline to fill several gaps below (Chart 2).
From a bearish perspective on a breakdown of the current downward channel, a potential low in SPX likely concludes an LDT or a series of initial ones and twos (Chart 3).
Thursday, April 20, 2017
Wednesday, April 19, 2017
Tuesday, April 18, 2017
Monday, April 17, 2017
Market Timing Update (4/17/17)
[EOD] Stocks-
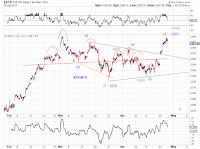
SPX rebounds to its 50DMA (Chart 1). A couple of potential bearish/bullish triangles (Chart 1 and Chart 2) among other tracking counts (Chart 2).
SPX rebounds to its 50DMA (Chart 1). A couple of potential bearish/bullish triangles (Chart 1 and Chart 2) among other tracking counts (Chart 2).
Saturday, April 15, 2017
MTU Weekend Ed. - Short Term Update (4/15/17)
SPX closed below its 50 DMA (Chart 1), with a cluster of open gaps below (Chart 2). The wedge-down(potential EDT/LDT) offers potential for a bounce (Chart 3 green/red).
Wednesday, April 12, 2017
Tuesday, April 11, 2017
Monday, April 10, 2017
Friday, April 7, 2017
Thursday, April 6, 2017
Wednesday, April 5, 2017
Subscribe to:
Comments (Atom)


