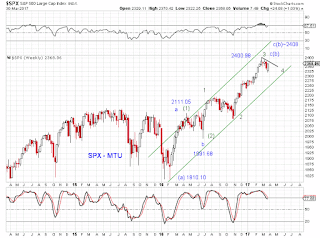
{EOD]Stocks -
quarter-end window dressing.
Disclaimer: Each post is for informational purposes only. It is not a solicitation, a recommendation or advice to buy or sell any security or investment product. Information provided in each post does not constitute investment advice.
Thursday, March 30, 2017
Wednesday, March 29, 2017
Tuesday, March 28, 2017
Market Timing Update (3/28/17)
{EOD]Stocks -
Three waves down in SPX followed by a strong rebound today. Possibilities include an abc-down (completed, or as part of a triangle, flat), nested 1s2s down, or a still-developing five-down with its wave four an ongoing triangle. Short term and longer term bull/bear tracking. See charts.
Three waves down in SPX followed by a strong rebound today. Possibilities include an abc-down (completed, or as part of a triangle, flat), nested 1s2s down, or a still-developing five-down with its wave four an ongoing triangle. Short term and longer term bull/bear tracking. See charts.
Monday, March 27, 2017
Market Timing Update (3/27/17)
[EOD] Stocks-
The 50DMA in SPX held (Chart 1). SPX is back at its overhead resistance area (Chart 2). While odds of a short term low has increased given the rebound, near term bearish options have not been exhausted (Chart 3 and Chart 4).
The 50DMA in SPX held (Chart 1). SPX is back at its overhead resistance area (Chart 2). While odds of a short term low has increased given the rebound, near term bearish options have not been exhausted (Chart 3 and Chart 4).
Saturday, March 25, 2017
MTU Weekend Ed. - MA, HS and Gaps (3/24/17 close)
SPX pulled back to its MA50 and bottom of its BB (Chart 1), is still negotiating with an HS neckline (Chart 2) and downward channel boundary (Chart 3). This pullback filled a couple of gaps. The next gap is within the reach of this potential HS pattern (Chart 2 and Chart 3).
Thursday, March 23, 2017
Market Timing Update (3/23/17)
[EOD]Stocks-
SPX closed below the neckline after having kissed it, but has failed to breach yesterday's low. See charts.
SPX closed below the neckline after having kissed it, but has failed to breach yesterday's low. See charts.
Wednesday, March 22, 2017
Market Timing Update (3/22/17)
[EOD] Stocks-
SPX kisses the neckline (Chart 1) and hugs the down channel (Chart 2). ES tracking from the high (Chart 3).
SPX kisses the neckline (Chart 1) and hugs the down channel (Chart 2). ES tracking from the high (Chart 3).
Monday, March 20, 2017
Friday, March 17, 2017
Thursday, March 16, 2017
Wednesday, March 15, 2017
Tuesday, March 14, 2017
Market Timing Update (3/14/17)
[EOD] Stocks -
Potential HS in SPX, but need to break the neck line (Chart 1).
Previously discussed scenarios in ES remains, upgrading (b)-down, downgrading (i)-down as shown (Chart 2) since the neckline is holding.
Potential HS in SPX, but need to break the neck line (Chart 1).
Previously discussed scenarios in ES remains, upgrading (b)-down, downgrading (i)-down as shown (Chart 2) since the neckline is holding.
Monday, March 13, 2017
Market Timing Update (3/13/17)
[EOD] Stocks -
We noted last week that "S&P futures are showing a potential five-wave decline from its all time high, suggesting the pullback (degree uncertain at the moment) is likely not over." Today's price action remains consistent with such potentials. See updated charts.
We noted last week that "S&P futures are showing a potential five-wave decline from its all time high, suggesting the pullback (degree uncertain at the moment) is likely not over." Today's price action remains consistent with such potentials. See updated charts.
Friday, March 10, 2017
MTU Weekend Ed. - Five Down? (3/10/17)
We are at a Fib-8 year high from the 2009 bottom. S&P futures are showing a potential five-wave decline from its all time high, suggesting the pullback (degree uncertain at the moment) is likely not over. See charts.
Thursday, March 9, 2017
Market Timing Update (3/9/17)
[EOD] Stocks -
Potential five-wave decline in ES from the high. If so, expect another wave of decline following a rebound (to perhaps the 2380 area). See chart.
Potential five-wave decline in ES from the high. If so, expect another wave of decline following a rebound (to perhaps the 2380 area). See chart.
Wednesday, March 8, 2017
Subscribe to:
Comments (Atom)


