Thursday, February 28, 2013

Market Timing Update (2/28/13)

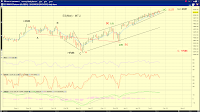
[2pm] SPX update -
A potential small-degree five-wave advance from recent low is likely approaching its end. Counts as [i]-up of 5-up, (c)-up of [b]-up of 4-down (or [ii]-up except for the Dow). See charts.


[805am] ES update -
Month end. ES squiggle from pullback low has a bullish impulse or a bearish flat (Chart 1). See yesterday's EOD update for top near term tracking counts.


Wednesday, February 27, 2013

Market Timing Update (2/27/13)

[330pm/EOD] Stocks -
Dow made higher highs but other indexes have lagged so far (Chart 1).

This presents two interesting bullish and bearish counts across Dow and SPX.

The consistent bullish count is that wave 5-up is under way after a flat correction in the Dow and a zigzag correction in SPX (Chart 2, green).

The consistent bearish count would be a wave 4 correction still in progress. We might have an expanding triangle in the Dow (Chart 3) and an ABC-X-ABC structure in SPX (Chart 3).  This would likely surprise the market.


[1140am] SPX update -
SPX tracking squiggles: ABC over, ABC-(X)-, A B(flat)-, A B(triangle)-, [i]/[ii]/(i)-
Transports made a higher high, upgrading some of the above tracking counts and downgrading the others.

[805am] ES update -
ABC, ABC-(X)-, [i]/[ii]/(i)-


Tuesday, February 26, 2013

Market Timing Update (2/26/13)

[355pm/EOD] Stocks -
There you have it, today's rebound reached a FIB-382 of yesterday's decline (Chart 1). Larger counts are unchanged (Chart 2).


[810am] ES update -


Monday, February 25, 2013

Market Timing Update (2/25/13)

[350pm/EOD] Stocks -
ABC-down (bullish) or [i]/[ii]/(i)-down (bearish) in SP500. See charts.


[1015am] SPX squiggles -
Bullish and bearish squiggles.


[1005am] SPX update -
INDU made a higher high while other indexes have lagged (Chart 1). If other indexes follow through higher, a flat-like wave 4 correction was likely over (Chart 2, black).


Friday, February 22, 2013

MTU Weekend Ed. - Short Term Update (2/22/13)

SP500 lost 2.2% (or 34 index points) over a two-day period this past week, giving back all the gains over the preceding three weeks.

Moreover, the price pattern in SP500 from its high (1530.94) has now traced out a five-wave decline followed by a three-wave rebound (which is itself an overlapping 7-wave structure or 7-up). See Chart 1. This price profile suggests potential reversal at a larger degree or degrees, based on EWP.


Zooming out, we see that the latest sell-off fits nicely with
[1-bullish] wave [a]-down of a wave 4 correction within the post-November-low upswing (Chart 2, green). After the proposed wave [b] rebound exhausts, wave [c]-down should follow to conclude the wave 4 pullback. A 5th wave advance, potentially weak, will likely complete the Hope Rally.

[2-bearish] the initial sell-off (Chart 2, blue) following the end of a major 7-wave rise from the 2011 low (Chart 3) as well as the conclusion of an interesting fractal (Chart 4). Please see 7-Up and Mature Fractal (2/15/13) for discussions.


The price profile in VIX echoes these two near term scenarios. See Chart 5.

Short term trend has likely turned down. It’s reasonable to expect a wave [c] of 4 decline or a wave [iii] sell-off based on these scenarios.


Wednesday, February 20, 2013

Market Timing Update (2/20/13)

[EOD] Stocks -
Chart 1 updates Chart 4 in 7-Up and Mature Fractal (2/15/13).  The proposed wave 3 or wave C, as well as the potential fractal point #10, are likely complete.

Chart 2 tracks squiggle counts from the recent high in SP500.  Today's sell-off so far counts as either a three / incomplete five (red) or a completing impulse with an extended fifth wave (blue).   Each count has appealing features in the manner waves channel.


Saturday, February 16, 2013

MTU Weekend Ed. - 7UP and Mature Fractal (2/15/13)

SP500 crawled up another 0.12% over the past week, including a fresh recovery high to 1524.69 on Feb 13th. Stocks, while taking their time, are on track to complete the proposed final upswing of the Hope Rally (Chart 1).

The proposed final upswing likely commenced at the November low (black point 6 in Chart 1). If it is a three-legger (ABC) structure, it is likely approaching its end. If it is a regular five-wave structure, it likely is missing wave 4-down and wave 5-up. There is the possibility that wave 4-down is already in progress with a potential upward bias.


7-UP
The small-degree price fluctuations over the recent weeks do not alter the larger degree profile that we have a seven-overlapping-wave advance since the major low in 2011 (Chart 2, black). Based on EWP, an overlapping seven-wave structure is likely corrective, is complete when the final upswing is complete, and is likely to be followed by a major (higher degree) reversal. If so, it should coincide nicely with the end of the Hope Rally. In terms of wave labeling, an ABC-(X)-ABC structure appears to be reasonable (Chart 2, red). Furthermore, each of these 7 waves is potentially a three wave structure itself, as labeled.


A Mature Fractal
Recall that the fractal in Chart 3 has helped us navigate major swings in the 2nd half of 2011. The potential fractal had afforded us the insight that the November low is potentially point 6 of the Hope Rally (Chart 1) and the December pullback is likely only an interim correction within the upswing to point 7 of the Hope Rally (Chart 1).

At current levels, an interesting price relationship suggests that the market may be approaching point 10 of the fractal (Chart 3). Note that during the 2011-2012 window, point 8 sits around the Fib 0.382 division point with respect to the distance from point 7 to point 10.

During the present 2012-2013 window, point 8 is again around the Fib 0.382 division point (Chart 4), suggesting a mature upswing if the proposed fractal continues to track. 


However, SP500 did exceed the fractal-projected top by about 10 index points at its recent high. How does one reconcile this discrepancy? We offer three reasonable scenarios.

(1) Extrapolating the proposed fractal to point 10 is a stretch. The proposed fractal no longer tracks.
(2) The projected pattern likely only rhymes with, but does not exactly track the past pattern. Thus, a minor "misalignment" is within "model" tolerance. It's prudent to heed the message embedded in the larger degree pattern.
(3) In 2012, a small-degree 5th wave experienced truncation (Chart 3) whereas the current small-degree 5th wave does not suffer from truncation. This subtle difference in the wave structure explains the discrepancy and brings the two cycles into alignment.


Friday, February 15, 2013

Market Timing Update (2/15/13)

[1215pm] SPX update -
a follow up on finished and unfinished business discussed yesterday. See charts.


[820am] ES update -
Note the potential bullish triangle and the bearish implications should it fail. See chart.


Thursday, February 14, 2013

Market Timing Update (2/14/13)

[EOD] Stocks -
Updated squiggles. See 140am for additional discussion.

[140pm] SPX update -
Finished business (green, red) or unfinished business (blue). See charts.

[8am] ES update -


Wednesday, February 13, 2013

Market Timing Update (2/13/13)

[EOD] Stocks -
No change for the big picture (Chart 1). Chart 2 updates tracking squiggle counts for the proposed [v] of 3/C.


[1130am] SPX update -
Tracking counts and squiggles. See charts.


[805am] ES update -