Friday, January 31, 2020

MTU Month End Ed. - Reversal or Larger-Degree Pullback (1/31/20)

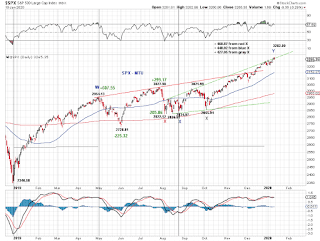
SPX tested its SMA50 today (Chart 1)

Last Week (1/24/20) Tracking count from Reversal or Small-Degree Pullback (1/24/20)

This Week (1/31/20),  the size of the net decline from ATH, based on wave degree considerations,  eliminates the small-degree pullback (green scenario in Chart 2 above,  b-down of (z)[e]-up form the red X in Chart 1 above).

Chart 3 below updates Chart 2 incorporating this week's additional sell-off.  

Furthermore, the possibility of a larger-degree pullback remains  (green scenario in Chart 3 below,  [b]-down of  Y-up from the grey X in Chart 1).


Chart 4 and Chart 5 update the triple-zigzag or the impulse tracking from the Oct low in ES.


Saturday, January 25, 2020

MTU Weekend Ed - Reversal or Small-Degree Pullback (1/24/20 close)

There are now enough waves to complete a potential triple-zigzag or impulse in ES / SPX since its October low. Please Expanding EDT & Triple Zigzag (1/17/20) for larger-degree details. Chart 1 (triple zigzag) and Chart 2 (impulse) update.

For the triple zigzag tracking count, it's possible that Friday's pullback is wave b-down of wave (z)-up. See Chart 3 for squiggles ( blue: completed impulse; black: completed final zigzag; green: b-down of (z)-up in the final zigzag).


Friday, January 17, 2020

MTU Weekend Ed. - Expanding EDT & Triple ZigZag (1/17/20 close)

It's time to revisit a potential expanding ending diagonal triangle in SPX first highlighted in May/Aug Line (12/7/2019) and updated many times since, referred to by the red X and green expanding EDT boundary lines there.

Here is the current bigger picture on SPX - note the red X and green boundary lines

In fact, in ES, the advance since early October may count better as a triple zigzag then an impulse (or at least as well as).   Note the nice fib-like ratios.

EWT implications by the triple-three tracking count
-  the same price cap as an impulse count (see chart below) assuming the 3rd zigzag above remains shorter than the 2nd.
-  most likely a terminal advance in the sense that following reversal corrects the entire advance in 2019
-  the speed of the decline post-reversal is likely to be faster than based an impulse count

Comparison to an impulse count (see Chart below). 

Finally, the Chart below updates the unfilled gaps in SPX cash.  The labels in this charts assumes the blue X.