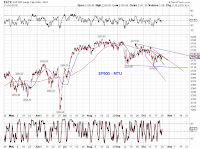
Price actions since the August all-time high in SP500 now present three potential (leading or ending) diagonal triangles (DT) at three different degrees, which can partially account for the messy waves since then. See Chart 1.
[blue - the big DT] A contracting DT. In this case, SPX can rise to the upper blue line before reversing.
[red - the medium DT] An expanding DT. SPX is likely to hit the lower red line for its wave E-down.
[green - the small DT] An expanding DT whose detail is shown in Chart 2.
Of course, there are other options for us to keep an open mind. Chart 3 updates.


