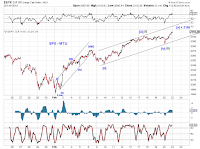
Stocks broke out from a 3-day consolidation to a new record high this past week. SP500 appears to be ready to deliver an overthrow with respect to the blue trend line in Chart 1 either as the green wave (3)-up of [5]-up or the blue EDT wave (5)-up of [3]-up. At the same time, odds appear to favor a new high in the Nasdaq Composite index, which is 3.5% away (Chart 2).
If Friday’s break out in SP500 is a small degree wave [v] off its February low (Chart 3) which would be consistent with the less-impressive cumulative AD-line (Chart 4), the near term upside should be capped around 2146 as wave [iii] cannot be the shortest wave. Near term support levels for SP500 are around 2070 and 2030 at the moment. A bullish alternative is an extended wave [iii] highlighted by the green labels.
The decennial pattern and the presidential cycle point to a slight downward tendency for the rest of the month. See Chart 5 and Chart 6.


