stocks, bonds, USD, gold
Stocks -
The new all time high in SP500 removed the possibility that stocks have already topped in December and supports our assessment that odds favor a top in the March-April timeframe. See It’s TIME (1/24/14) and Chart 1 below.


Friday’s new all time high likely counts as wave (a) or (i) of [c] (Chart 2), suggesting a pullback followed by another upswing to deliver an overthrow (see Overthrow, 2014 (2/14/14)). Support levels for a near term pullback is around MA50 currently at 1821.
There’s the outside chance that stocks topped on Friday, since the minimum requirement (of a new high and a complete wave structure off the February low) for the top is now met. However, the Dow is still shy of its previous high. We are still one month short in time and some index points shy of a larger overthrow (Chart 1).
Bonds -

Under the green count, recent weeks’ rally counts as (ii)-down of [v]-up in the yield space. The 2013 low in yield must hold.
Under the red count, 10Y yield has potentially begun a wave [c] or [iii] decline. The initial target is around 2.25%.
Note that the trend line connecting the 2013 and 2014 yield lows appears to be important at the moment.
USD -
The USD index has been declining for the entire month of February, without suffering technical damage in either direction (Chart 4).
If the USD index rebounds from current levels, near term upside potential points to the 82-83 area before running into some long term resistance (Chart 5).


At the same time, a potential head-and-shoulders pattern is emerging which points to a drop toward the 73 area if it materializes (Chart 4). A failed HS attempt likely introduces upside breakout potential for the USD index with respect to its long term resistance (Chart 5).
Gold -
Chart patterns for gold priced in euro and yen suggest continued upside potential (Chart 6 and Chart 7), particularly if the dollar weakens.


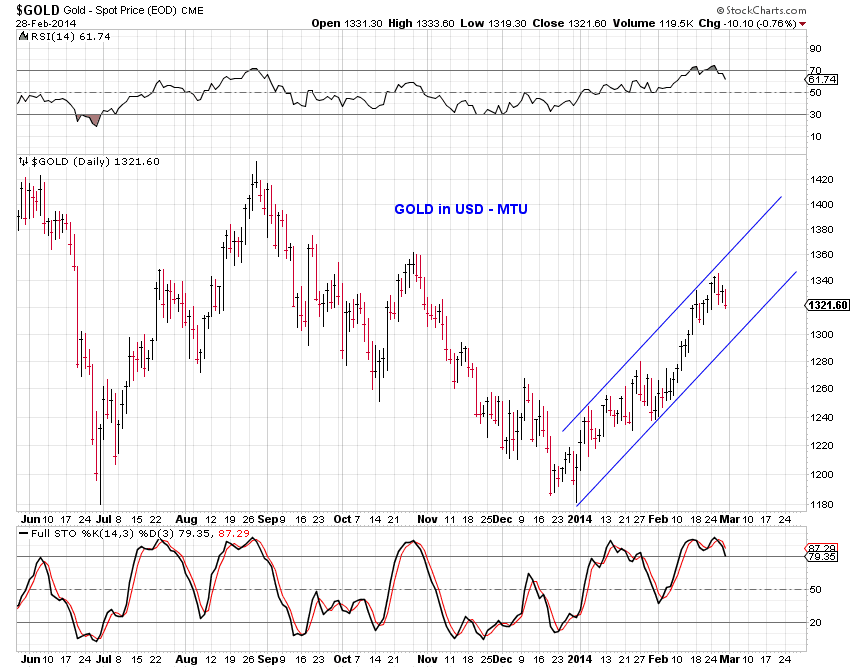
Readings on gold price in USD are mixed. While gold has broken above the 2012-2013 resistance line (Chart 8, red), it is now approaching short term channel resistance (Chart 9). A retest of the 2012-2013 resistance line is likely.