SP500 finally took out its October top and made a new record high this past week amid Yellen-driven bullish sentiment. The breakout was also on the back of a potential inverse head-and-shoulders pattern (Chart 1) which points to a measured target around 1805. Friday’s high in SP500 was 1798.22.
We track the pending small degree high as
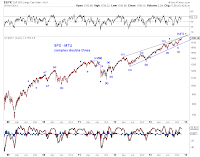
[red] the end (wave 5) of the advance since the October low. Note that the Dow made a lower low in October. This particular top can also serve as the end of a complex double three structure since the 2009 low (Chart 3, blue), or the end of wave (C) of a diagonal triangle since the 2009 low (Chart 5).
[green] wave [iii] of wave 5 of the advance since the October low, suggesting one more down-up subdivision for this particular wave.
[blue] wave 3 of a fresh upswing since the November low. Note that the upswing since the November low can also extend following the initial five-wave advance.
At this juncture, the big-picture tracking counts are both more relevant and interesting. See Monthly Outlook Update (11/1/13).
As anticipated, SP500 continues to crawl along the green upper resistance line (Chart 2) as it makes higher highs. See Short Term Update (11/8/13).
Chart 3 updates the progress of a complex double three structure since the 2009 low.
Chart 4 updates its bullish counterpart.
Chart 5 updates the progress of a potential diagonal triangle since the 2009 low.


