SP500 is likely in wave five of a five-wave advance from the October low (Chart 1). The minimum requirement of a completed impulse has now been met (Chart 2). Early next week, SP500 is likely to conclude wave five, or wave one of wave five if wave five extends. Expect a consolidation or a larger degree reversal to follow.


While SP500 has broken above the 2000-2007 resistance line, it is now approaching the upper trend line of the Hope Rally (Chart 3). Resistance along this upper trend line is likely as the corrections in 2010, 2011 and 2013 suggest. We will update wave count details on the Hope Rally in our monthly outlook update next week.
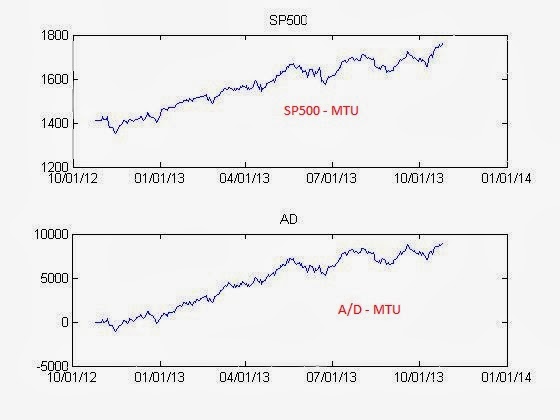
Market internals are also less impressive than price advances. SP500 cumulative advance-decline line is lagging the index itself. See Chart 4.