Chart 1 shows the wave structure of the current advance which is challenging the 2012 high in SPX. Chart 2 shows the top near term options.


[green] The proposed wave (5) is extending, with 3/4/5 to come.
[blue] The proposed wave (5) is an expanding EDT (see trend lines) or extending in a 1/2/[i]/[ii] fashion.
[gray] Bullish expanded flat correction which will frustrate both bulls and bears. [c]-down to come. This is the green count in Chart 1.
[red (5) following green (4)] The blue 3 or red [c] of Chart 1 topped today. This appears to be less likely as the final wave [v] is very small.
Subjectively speaking, the gray and green counts are appealing.
As discussed in the 2pm entry below, the proposed wave (5) is capped at 1448.11, and likely at 1428.06 - unless the gray count plays out.
[2pm] SPX update -
Don't know if the proposed wave (5) is done, an EDT (see chart) or will extend at the moment. But note that the proposed wave (3) is smaller than wave (1), so the proposed wave (5) is capped at 1448.11 (with a more probable cap around 1428.06).

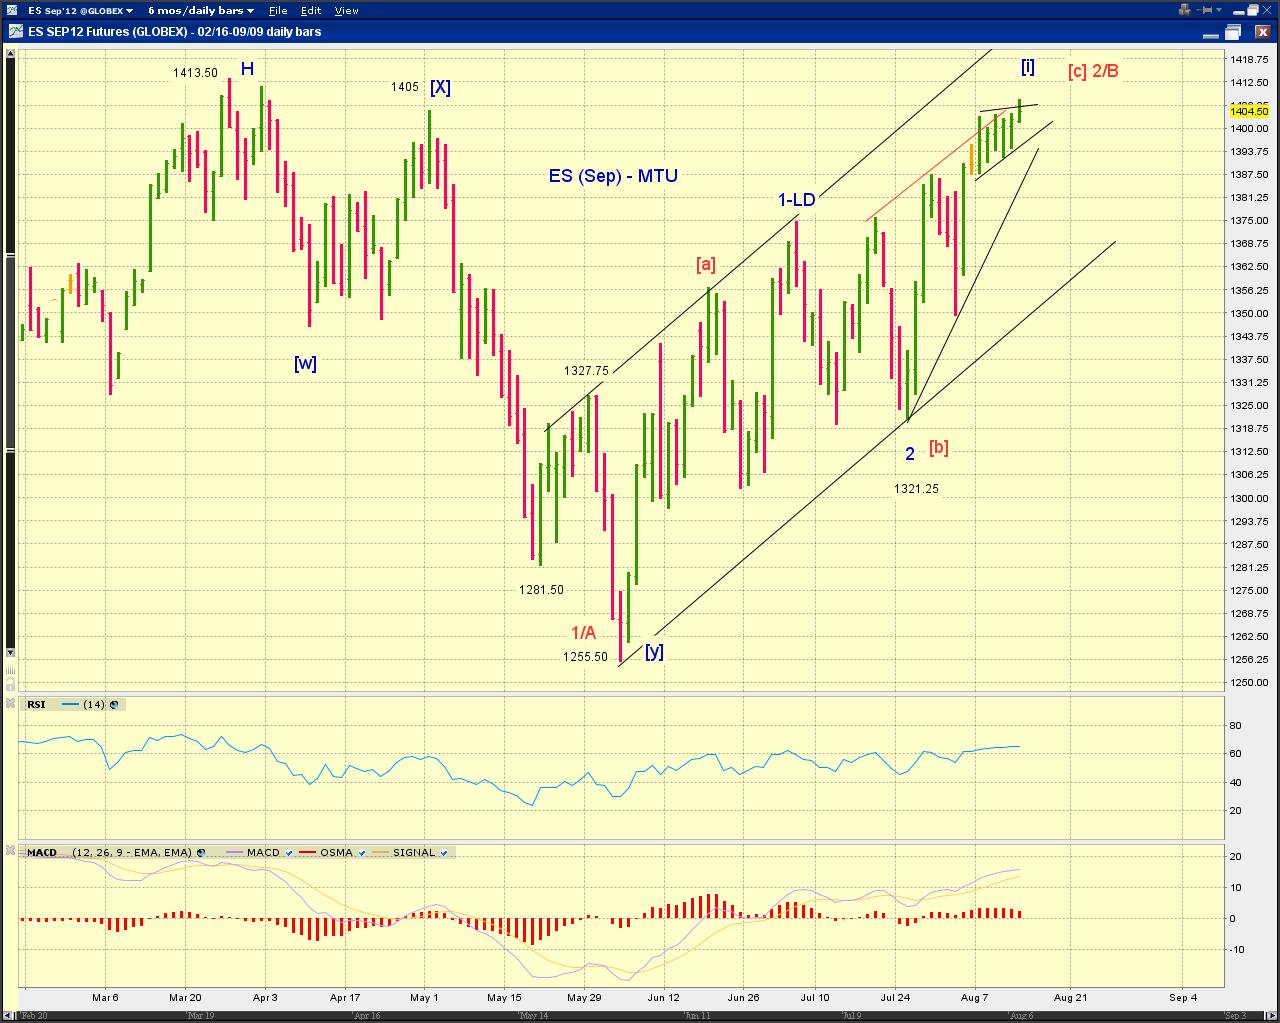
[710am] ES update -
ES is challenging its 2012 high. The pullback since 4am EST counts as a small-degree 4th wave at the moment. Alternatives are D/4-down of an EDT (red trend lines) or start of c-down of an expanded flat (green).