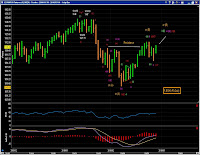
 The market is nearly flat for the week, with SPX down -0.42%. But the past week was volatile, with overnight and intraday spikes in both directions. Compared to last Friday’s close, SPX reached a +0.28% high on Monday and a -2.09% low on Thursday. There has been no change in the poor reward-risk profile for long exposure over the past two weeks. See Despite the rally, little change in risk/reward -2/19/10, and Upside potential no longer compensate for downside risk-2/12/10.
 Wave [ii]-up from the 2/5/10 low might have ended a week ago. But without a decisive decline with follow through (or a new high), it is possible that wave [ii]-up is still subdividing higher. Technically speaking, the second wave can retrace nearly all of the first wave's movement.
The above statement by itself is a weak justification for staying bearish. However, it is applicable at the current phase of the market, based on the larger wave structure, fundamentals and technicals.
 Chart 1 presents the wave structure of the market since its January peak, with one bullish count to new highs and several bearish counts of wave [ii]-up. To summarize,
(1) (Green Labels) The bullish count assumes the rise since the 2/5/10 low is the start of an advance to new highs, possibly by way of wave 5 or the third three from March 2009.
(2) The bearish counts assume wave [ii]-up of 1-down is a double three that is already complete (red), OR a triple three that is still in progress (red), OR an expanded flat that is still in progress (pink). The yellow label highlights the possibility that the rebound is a (B) wave, rather than wave [ii]. These counts rule out any new highs and imply lower lows once they are complete.
If wave [ii]-up was complete on Feb 22 or Feb 23, Chart 2 presents ways to count the price action since then. The wave [iii] sell-off can start at any moment by these counts. A rise above 1112.75 in the March SP500 Emini will invalidate these immediately bearish counts.
The volatility index, VIX, made a lower low this Friday. Chart 3 offers the primary count of the VIX, with Friday’s low or the coming low as (B) of an (A)-(B)-(C) structure. It’s possible that what’s labeled as (A) is actually a (1), but wave 4 of (1) is almost invisible. The way wave (C) (or (3)) develops will offer clarification.
No comments:
Post a Comment