Thursday, April 15, 2010

Market Timing Update (4/15/10 Close)

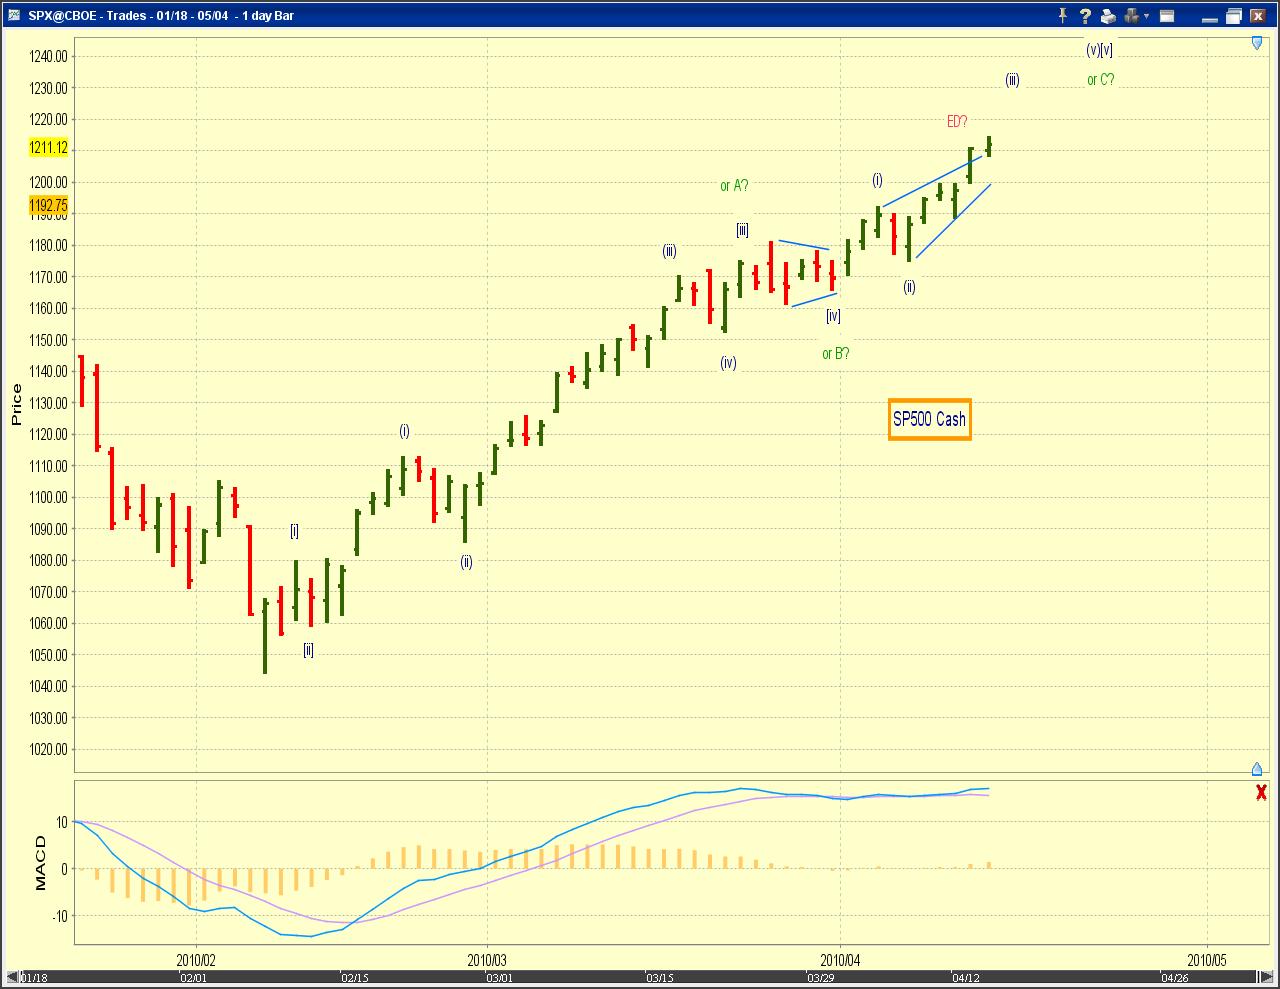
With perhaps the exception of the ending diagonal count, near term bearish counts are being increasingly and seriously challenged. Sentiment and the path of least resistance are supportive of higher near term prices. At the same time, the ED count may just survive. It's prudent to keep an open mind and accept the wave structures as they present themselves.

Chart 1 on the SP500 cash index highlight the top two near term counts, one bullish and one bearish (ED). The famous triangle is either wave [iv] or wave B in both counts. The difference lies with the structure of the post-triangle thrust.


The bullish count has a regular (and extended) five post triangle. The squiggle count places today's high near iii of (iii). There should be more upside potential near term under this interpretation. This count is also more in sync with that in the RUT.

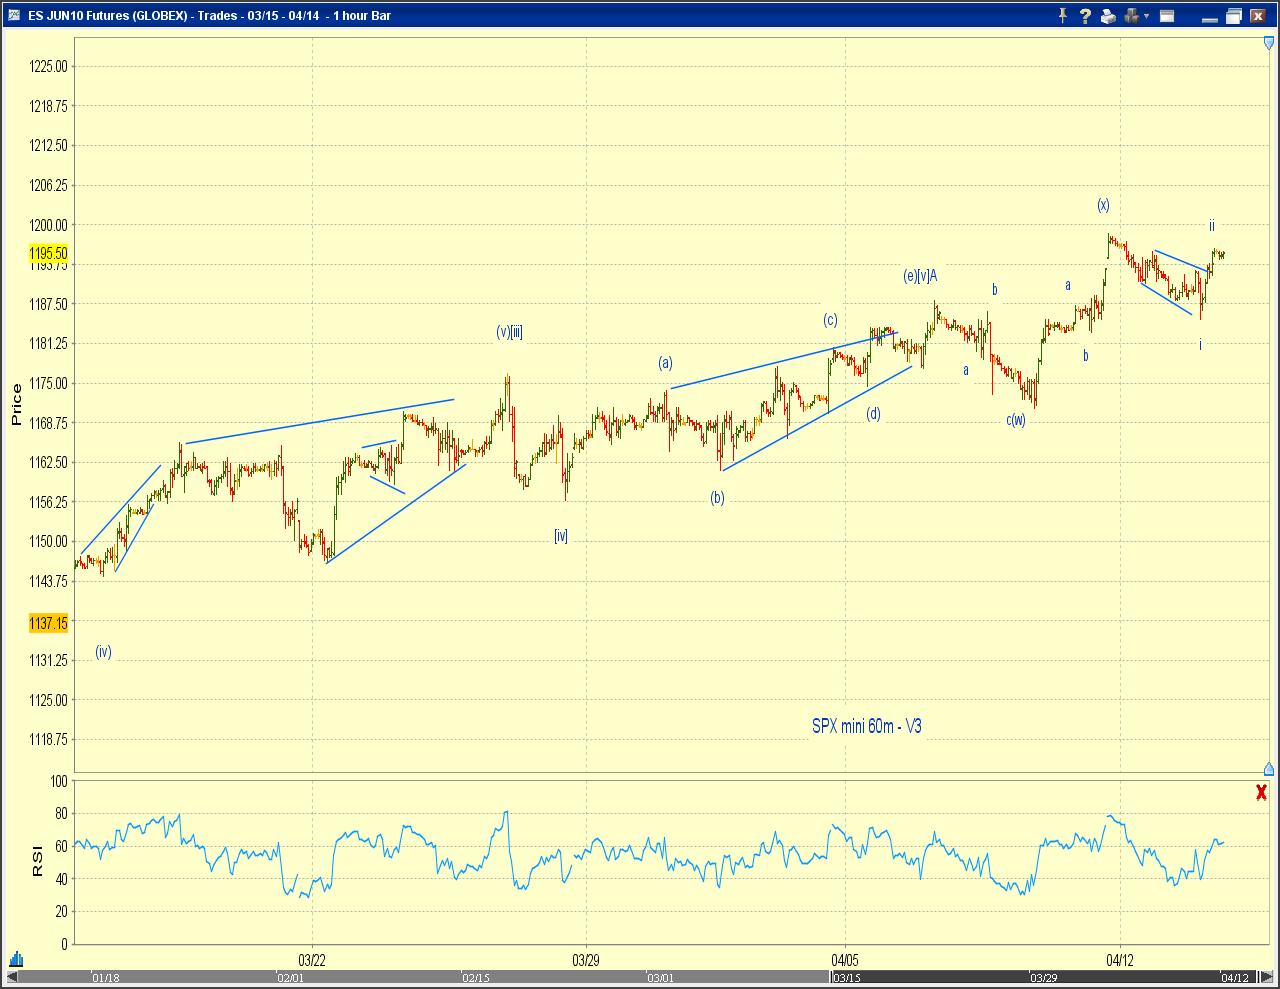
The bearish count has a contracting ED post triangle (Chart 2). Note that today's high could be the top as we may have a truncated small-degree fifth wave as the end of c of (v)[v] this afternoon (Chart 3). Alternatively [4] of c of (v)[v] may be still in progress - potentially another small triangle? - as also indicated in Chart 3.

Wednesday, April 14, 2010

Market Timing Update (4/14/10 Close)

All three near term counts remain in play (Chart 1). Market sentiment has been in favor the most bullish of the three (the blue labeled count in Chart 1) or even some ultra-bullish case.

[Blue] An contracting triangle followed by a contracting ED.
Today's high is either wave (iii) of the contracting ED or the end of the ED itself.


Chart 2 shows the price action in the SP mini over the past two days can be counted as a completed (or nearly completed) zigzag.

[Red] No-triangle wave [iv] followed by an expanding ending diagonal.
The top could be in at today's high as indicated by the red trend lines as well as the squiggle count in Chart 2.

[Green] An expanded flat wave B of (Z).
SPX should be nearing the end of [b]-up of B-down. Wave [c]-down should start soon.


RUT-The more bullish near term count (blue) seems to be echoed by the RUT, which keeps on subdividing higher. Chart 3 offers a near term count of the RUT.

VIX- The VIX index did not suffer a new low today despite new highs in stocks.

Tuesday, April 13, 2010

Market Timing Update (4/13/10 Close)

Chart 1 (which updates Chart 1 in yesterday's update) tracks the near term price action well. It highlights the three near term top counts in SPX.

(blue) Triangle [iv], followed by a [v] being still in progress. Today's price action greatly increases the odds that wave [v] is tracing out an contracting ending diagonal (Chart 2). Chart 3 offers a squiggle count of (v)of [v] or (e)of [v].

A much more bullish alt count is that (iii) of [v] is extending, with today's high as [1] of (iii) of [v]. This possibility is also marked in Chart 3. The probability is not high though - we'll see.


(red) Non-triangle [iv], followed by an expanding ending diagonal.
This count suggests that the 4/11/10 after-hours high in the futures is most likely the top. The decline from that top is a leading diagonal wave i-down. And the rebound from today's low is a zigzag wave ii-up - as long as there's no more new recovery highs (Chart 4).


(green) Wave A of (Z) ended on 4/6/10. Wave B of (Z) is tracing out an expanded triangle. Wave [c]-down of B started at the 4/11/10 after-hours high in the futures (Chart 5). The count of the decline from that top is the same as the one discussed in the red-labeled count above.

Monday, April 12, 2010

Market Timing Update (4/12/10 Close)

Chart 1 highlights the three near term top counts in SPX


(blue) Triangle [iv], followed by a [v] being still in progress.
SPX is most likely in a small degree 4th wave - (iv) of [v] or iv of (iii) of [v] - which may or may not be done. Note that high of wave iii or (iii) occurred overnight in the futures (Chart 2), which is not visible in the cash index.

(red) Non-triangle [iv], followed by an expanding ending diagonal.
This count suggest that the top may already be in.

(green) Wave A of (Z) ended on 4/6/10. Wave B of (Z) is tracing out an expanded triangle. Wave [c]-down of B is about to commence.

Friday, April 9, 2010

MTU Weekend Ed. - A Potentially Major Turning Point (4/9/10 Close)

Updated - added: Less than 5% upside for FTSE100 ?

Key overhead resistance and updated projections

The broader stock market managed a new recovery high, with the Dow briefly touching 11000 Friday. The SP500 index has advanced 1.38% over the past week.

Stocks are in the neighborhood of a couple of big-picture resistance levels discussed in Projections (4/1/10). “In terms of wave relationship at a larger level, note that the 0.618 retracement of the Oct07-Mar09 sell-off is 1228.74, and 1245.67 is where the net advance of (Y) and (Z) of P2 equals that of (W) of P2.”

In SPX in Foreign Currencies is Telling (10/30/09), I discussed two EW-based targets according to two internal counts of SPX priced in FX baskets. The less bullish target was invalidated by the subsequent continuing rally.

The more bullish target is now +4.22% above the current levels of SPX priced in FX (or SPX*FX). Reaching this target in SPX*FX can be accomplished by a decline of 4.22% in the USD index, or a rise in SPX or more likely, a combination of both.

The historic date which corresponds to this SPX*FX target is 9/8/08 - a fatal week that marked the beginning of the failure of several major financial institutions and the acceleration of the financial crisis (see the TimeLine). It should be noted that on that day SPX has a high of 1274.42, a low of 1247.12, and a close of 1267.79. Chart 1 below was published on 11/1/09 and Chart 2 below offers an update of the subsequent price actions.

shown on 11/1/09 --------------------------------------- current update

This can probably be the final advance of the bear market rally.

[1] In terms of the level of complacency, it is only surpassed by that during the credit mania climax.

In the previous MTU weekend edition (4/1/10), I mentioned that if VIX reflects the general sentiment towards risk, the current level of complacency is only surpassed by that during the final phase of the credit mania. Historically, VIX has only been lower than its current levels (a low of 16.06) when SP500 is around its current levels (a high of 1194.66) during the 2002-2007 credit mania climax. (Chart 3, updated).

This Friday, the VIX closed at the LOWEST level since the October 2007 stock market peak. The intraday low on Friday was 16.06, leaving the 15.82 low on 5/19/08 as the only lower intraday reading on VIX between then and now.

[2] Even the most strategic bears have been hedging their views in recent weeks with one more down-up sequence. That is, the February low is now labeled as an (X) wave by many, including yours truly, with one more A-B-C to come. It may be time for the contrarians to be more contrarian.

[3] Instead, a zigzag-(X)-zigzag-(X)-flat structure may very well be a good description of P2.

One appealing feature of this count is that it is able to describe the wave structures of both SPX and RUT, two diverse and seemingly out of sync indices. The second (X) of the SPX counts as a running flat (with B=1.35A) whereas the second (X) of the RUT a regular flat. See Chart 4 and Chart 5.

While this is may or may not be the right count, but the possibility/probability is there. If this is the case, the rebound since 2/5/10 is wave C of (Z), and the final wave. Those who can discern a completed five from the squiggles will have an edge.


Less than 5% upside for FTSE100 ?
The FTSE100 and SP500 have been highly correlated and have very similar wave structures. Fortunately, details of the wave structure are more obvious in FTSE100 at times. Key observations are that
[1] Both the corrective structure count and the impulsive structure count of FTSE100 point to a high likelihood of less than 5% of upside potential. The upside potential ranges from 0.6% to 4.47% depending on the count and the particular fib relationship. See Chart 6.
[2] The most generous/bullish count of the advance since the early February low places FTSE100 at nearing the end of [iii] of C (or 3 of (5) in the case of the impulse). See Chart 7.

It’s not unreasonable to map this count of the U.K. market into that of the U.S. market. It should be noted that the structure of SP500 appears a lot more corrective than impulsive since March 2009.

Footnote ... unless one accepts EWI’s proposition of a skewed triangle from 8/7/09 to 10/2/09 – but what do we make of the same structure in the FTSE100 then?

__________
Appendix
The appendix shows a number of squiggle counts highlighting the potential structure of wave [v] of C. A couple of them indicate that (v) of [v] is already in progress. One count places the market at (iii) of [v] of C.

Nearing a potential end of a run with an expanding EDT

... with an post triangle thrust (red labels) Or extending up and away! (blue labels)


Alt - Nearing the end of wave (x) of B of (Z), (y)-down of B to follow

Thursday, April 8, 2010

Market Timing Update (4/8/10 Close)

The impulse wave advance from today's low may support a near term bullish count, while declining volume during today's advance and near term overbought technical readings raise questions to such interpretations. The bullish and bearish counts are highlighted below.

On the bullish side, especially in the cash index, the post-triangle thrust is most likely extending. Today's advance is the third wave within this structure (Chart 1 - blue). At a lower probability, SPX may be in the final small degree fifth wave of the thrust (Chart 1 - red).

Chart 2 (blue labels) offers a squiggle count of today's price action in SPX cash, which may be a yet to be completed impulse wave.

On the bearish side, today's rise is wave C of an expanded flat which is most likely complete at today's high as indicated by Chart 2 (red labels). The rebound may be an (x) of B of (Z) (Chart 3 red) or ii of (iii)-down in an impulse wave decline (Chart 3 blue) . Note the rising volume during yesterday's sell-off and the declining volume during today's advance in the mini market (Chart 3).

Wednesday, April 7, 2010

Market Timing Update (4/7/10 Close)

Stocks, VIX and Gold

SPX-The advance since the 2/5/10 low is most likely over at yesterday's high. This potential is discussed in Chart 2 of yesterday's update. Today's decline represents reasonable confirmation.

The most relevant issue is whether this peak is A of (Z) or the end of (Z) within a P2-type count.
We will likely get confirmation of either case till much later. Chart 1 shows three partial counts that is consistent with either case. I'll explore counts that support the current peak being the end of (Z) in the weekend update.

The initial stage of the decline also indicates potential for both possibilities (Chart 2). The red labeled count in Chart 2 tracks wave B-down of (Z)-up, whereas the blue labeled count in Chart 2 tracks a potential P3-type development.


If one is willing to overlook the overnight price actions in the futures market and focus on the cash index, it's possible that we still have a fifth wave up to complete post-triangle. The red labeled count in Chart 3 illustrates this scenario. If this is the case, this afternoon's low in SPX is most likely (iv).

However, the rebound from this afternoon's low still has SPX contained in the base channel (Chart 4). Given the tight risk parameters in this situation, the market still needs to prove that a fifth wave is coming.


VIX-The same observation can be applied to VIX. Given the strong rebound in VIX, a lower low within the current near term structure needs to develop almost immediately if there is a lower low (Chart 5).


Gold - Chart 6 shows my current count of gold. Gold may be on its way to a new high according to this bullish count. Relatively speaking, it's more difficult to come up with a high-confidence bearish count unless gold is tracing out a flat with the current advance being wave b-up of that flat.