Thursday, January 31, 2019

Thursday Update (1/31/19)

Extended third wave of an impulse or of wave C (blue) likely.   Expanded flat for a wave B/2 if possible (red).


Saturday, January 26, 2019

MTU Weekend Ed. - Rebounding IV (1/25/19)

SPX has now spent a month rebounding from its December low and managed to close above its downward sloping 50-Day SMA.  The first leg is likely over.  Currently we are likely seeing reactions around 50-Day SMA.

Thursday, January 24, 2019

Thursday Update (1/24/19)

SPX: potential simple ABC rebound (blue) or potential sideways bearish triangle (red)

Wednesday, January 23, 2019

Wednesday Update (1/23/19)

Yesterday's and Today's rebound from the intraday lows in SPX appears to be reaction to the 50-day SMA (Chart 1).  The drop from the rebound high in ES can be counted as a five, Chart 2 shows the mapping into SPX.  If so, the small degree second wave rebound can retest the gray overhead trend line of a potential larger expanding diagonal triangle we have discussed previously (Chart 3).


Tuesday, January 22, 2019

Tuesday Update (1/22/19)

Either the blue 5 failed or the red C or green 5 (with a triangle green 4) completed at the rebound high.  See the weekend update for more details.


Friday, January 18, 2019

MTU Weekend Ed.- Rebounding III (1/18/19)

SPX closed above its 50-day SMA and has ventured into the prior congestion zone (Chart 1).   It likely is finishing an impulse wave, tracked as A-up or 1-up or D-up (of an expanding diagonal), from its December low (Chart 2 blue or green). Depending on where wave four ends, the current leg of rebound could be ending or has a small-degree wave four-down and wave five-up left  (Chart 3 SPX and Chart 4 ES).  If the first leg up from the December low is a zigzag, it's possible to track this rebound as wave (X)-up in its entirety (Chart 2 red).


Thursday, January 17, 2019

Wednesday, January 16, 2019

Wednesday Update (1/16/19)

It probably takes a gap down and go to confirm the red "terminal" count.  Otherwise, a small-degree [v]-up looks likely.


Monday, January 14, 2019

Monday Update (1/14/19)

SPX is poised to roll over.  A lower low is necessary to eliminate the potential fourth wave triangle, particularly in ES.


Sunday, January 13, 2019

MTU Weekend Ed. - Rebounding II (1/11/19 close)

The first two charts update the bullish and bearish tracking counts.  For the bearish tracking, given the size of the rebound, the current rebound is much more likely to be wave D-up of a diagonal triangle/ triple three (Chart 2) than a fourth wave (not shown).

Chart 3 tracks the squiggles of the current rebound.


Thursday, January 10, 2019

Thursday Update (1/10/19)

Minor breakout after a three-day consolidation (Chart 1).  Approaching resistance zone but reluctant to roll over.  Eyeing the 50% retrace and 50-day SMA? (Chart 2)


Wednesday, January 9, 2019

Wednesday Update (1/9/19)

SPX broke below the blue line at the close, just shy of invalidating a number of contracting or expanding wedges.  See previous updates for perspectives at larger degrees.

Tuesday, January 8, 2019

Tuesday Update (1/8/19)

This morning, SPX experienced the "largest" pullback since the previous pullback low of 2443.96.  SPX has been kissing and climbing the broken trend line for most of the day (Chart 1).   See yesterday's update for the larger degree tracking counts.


Monday, January 7, 2019

Monday Update (1/7/19)

SPX rose above 2558.19 and eliminates the most bearish 1/2/[i]/[ii] count. SPX is also approaching a fib-382 retrace of the selloff from its all time high, as well as the previous consolidation zone.  A short term retrace of the current rebound looks likely. The following charts update.


Sunday, January 6, 2019

MTU Weekend Ed. - Rebounding (1/4/19 close)

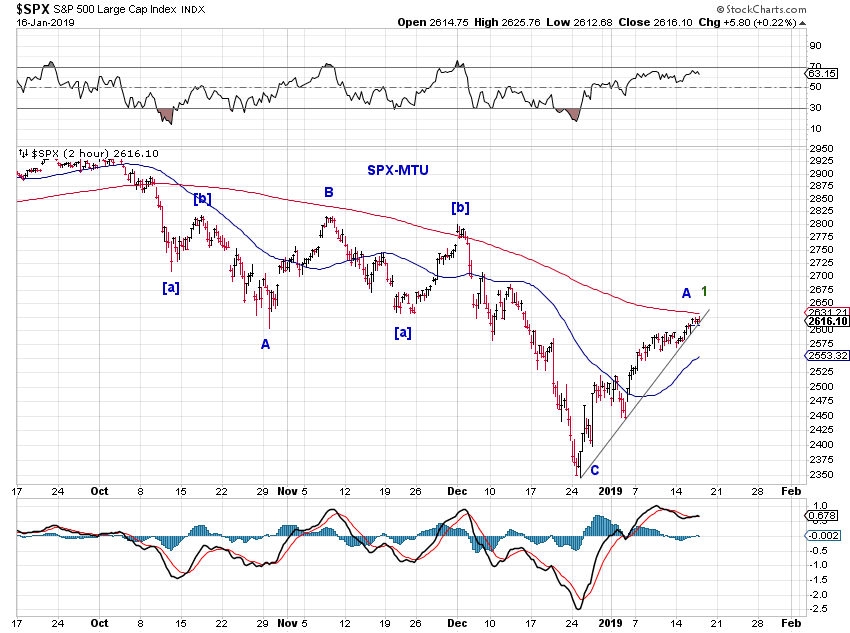
U.S. stocks are rebounding, likely correcting the three-wave decline since the all-time high (Chart 1).  Minor support and resistance levels are around 2505 and 2560 respectively.  Major support and resistance levels are around 2440 and 2700 respectively.  In addition there is the 2645-2660 range associated with the 50SMA and mid-BB. 


The rebound is also a three-wave structure so far.  As more price action becomes available, we can track the rebound associated with the long-term bull/bear scenarios highlighted in 2019 Outlook (12/31/18).

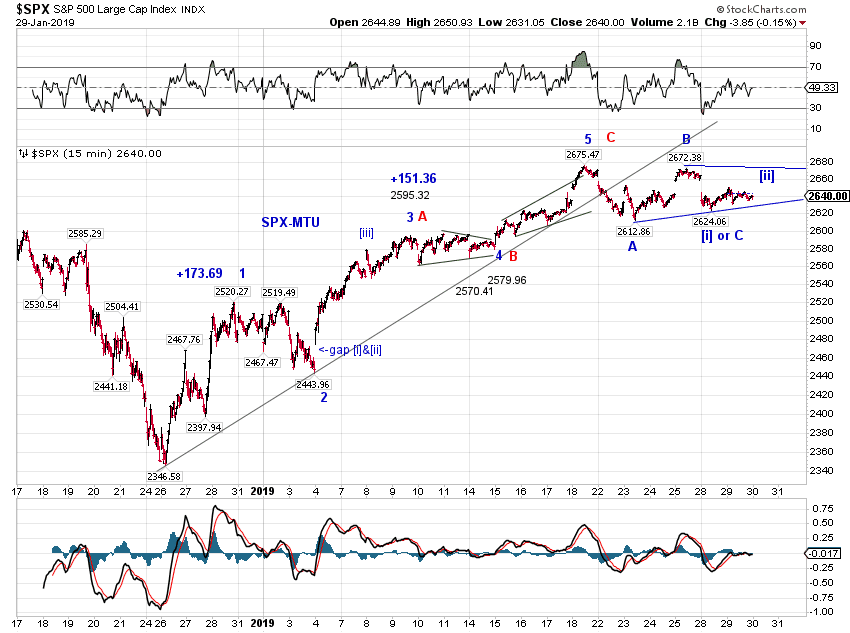
From a bearish perspective, while it's possible that the current rebound is wave [iv]-up relative to the 11/7/18 high (Chart 2 blue) , the fact that Nasdaq has overlapped its 11/20/18 low reduces the associated likelihood.  It the rebound is a fourth wave, it's more likely to be a larger degree wave 4 basis the all time high (Chart 2 green) - wave 4 could well be a triangle.  Equally if not more important,  the rebound could be a small-degree wave [ii]-up (Chart 2 red).

Chart 3 tracks the previous decline as an ABC and the current rebound as part of (X)-up or a new upswing (starting with a leading diagonal).


Thursday, January 3, 2019

Update (1/3/19)

There is little change to the short term tracking outlined in Three Waves Down (12/28/18).  The following charts update.  See 2019 Outlook (12/31/18) for perspectives on the bigger picture.


Tuesday, January 1, 2019

MTU Year-end Ed. - 2019 Outlook (12/31/18 close)

SPX is facing a larger degree decision point as the Q4 selloff in 2018 has brought SPX  to its post-election support.  The question is whether SPX is correcting the post-election rally (Chart 1) or something larger (Chart 2).  If it is the latter, the next layers of support is around 2000 and 1700.