Friday, May 30, 2014

MTU Weekend Ed. - Monthly Outlook Update (5/30/14)

stocks, bonds, USD, gold

Stocks
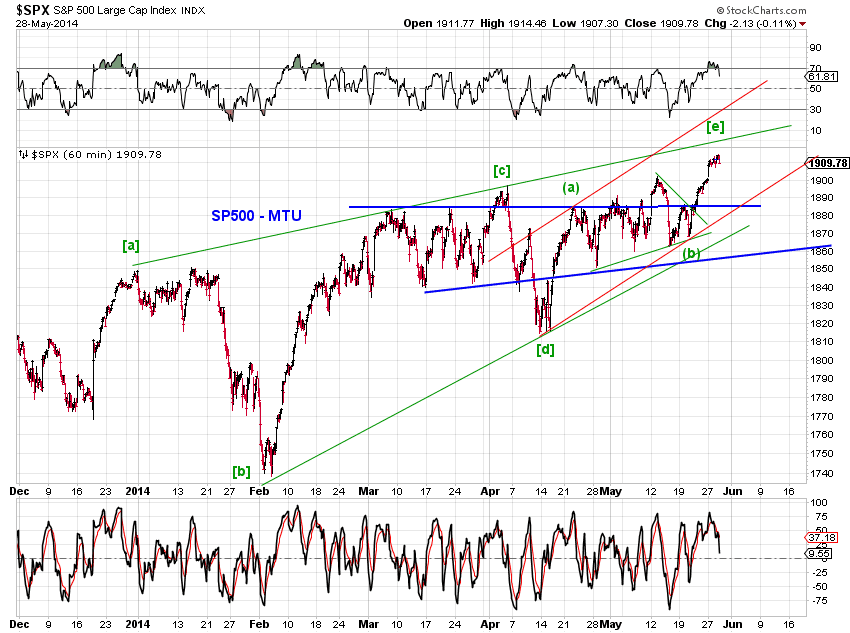
The overthrow surge of the proposed ending diagonal triangle in SP500 is indeed in progress (Chart 1 and see past weekend commentaries for additional discussion). The most recent small-degree upswing, which counts as wave (c) of [e] of the proposed EDT, is nearing completion (Chart 2).


Moreover, bullish tracking counts of SP500 and the Dow Transports since their 2009 lows also show potential major turning points ahead (Chart 3 and Chart 4).  While one should have patience for the topping process to run its course, selling opportunities are now emerging.


Bonds (US long term interest rates)
The staying power and the magnitude of the rally in U.S. Treasuries this year have surprised many market experts as well as economists. For example, the rally in the 10-year Treasuries is now 5 months and 60-some basis points and counting (Chart 5).

There have been a flood of disparate explanations for the slide in yields in recent weeks, from macro analysis, positioning, to supply and demand, an understandable development whenever experts are befuddled. What experts likely have failed to (fully) appreciate may be as simple as the long term trend in bonds (Chart 6).

We could not help but observing the following. See Chart 6.

[1] The market clearly has respected the red downward trend-line for decades. The 2014 rally, which "coincidentally" began at the same trend-line, is no exception.
[2] One can now count a 13-wave decline in long term interest rates from their early 1980s peak to the 2012 trough. As such, we may have a cycle low in rates since a 13-wave structure is consistent with a completed impulse wave according to Elliott Wave Theory. Furthermore, the tail end of the decline may be a (terminal) ending diagonal triangle as outlined by the green trend-lines.
[3] Rates are now retesting the green upper EDT line, a previous resistance factor but a potential current support.

In short, rates were "hammered" down by their long term resistance at the beginning of the year and now face potential support from a busted prior resistance.

To help market timing, we highlight additional support for 10-year yields on the daily chart (Chart 5).
[1] 10Y yields are now retesting the base channel indicated by the blue lines.
[2] The move off a bear flag appears complete or nearly complete, as indicated by the red lines. But also note the unfilled gap just below the current level.
[3] Friday's low sits around a Fibonacci 0.382 retrace of the upswing in yields from their 2012 bottom.

We are to witness whether the 2013 breakout in rates were successful. Odds appear to favor rates initiating their next upswing soon.


Dollar (USD Index)

We observed in Monthly Outlook Update (5/2/14) that "The dollar index has been making higher lows during a 2-plus-year consolidation,... One possibility is that the consolidation is nearing its end and another attempt to break above 85 is due."

This past month's price action further supports the bullish scenario.
[1] Chart 7 shows that the green trend-line as again supported the USD index during the most recent sell-off. In doing so, a potential head-and-shoulders structure most likely has failed to deliver. This development is bullish.
[2] The decline in the USD index since last November may be a terminal ending diagonal triangle (Chart 8). The index indeed broke above this potential EDT and is now retesting the breakout trend-line. This development is bullish.

Odds favor a higher USD index for the balance of the 2014, as long as the green support line holds. A decisive breach of the green support line brings would resurrect the bearish head-and-shoulders scenario.


Gold
There is no change on our view on Gold (see Monthly Outlook Update (5/2/14)). Chart 9 and Chart 10 update and illustrate.

[red] an initial low at the beginning of 2013, followed by an upward flat whose C wave has the potential to extend. 

[green] an orthodox low at the end of 2013. Whether it is the low won't be confirmed for a while.

In both scenarios,  the recent break down in Gold prices counts as a small-degree 2nd wave retrace.  A drop below the 2013 low would invalidate these scenarios, while the inability to break above the 2014 high on the next upswing would result in a bearish triangle off the 2013 low.


Thursday, May 29, 2014

Market Timing Update (5/29/14)

[EOD] Stocks-
Both SP500 (Chart 1) and the Dow Transports Average (Chart 2) are at record highs and at overthrow territory, while the Dow is still aiming at a new high. Chart 3 tracks squiggles in SP500 for the latest upswing.


[855am] ES update-

Wednesday, May 28, 2014

Market Timing Update (5/28/14)

[EOD] Stocks-
Potential wedge update. See charts.

[1130am] INDU/Transports update-

[720am] ES update-

Tuesday, May 27, 2014

Market Timing Update (5/27/14)

[EOD] Stocks-
Potential overthrow in progress in SP500(Chart 1) and Transports (Chart 2). Tomorrow represents a window of opportunity for a minor pullback or a turn.

[635am] ES update-
ES new high. Potential EDT, overthrow. New moon.

Saturday, May 24, 2014

MTU Weekend Ed. - Selling Oppornity Likely Approaching (5/23/14)

As observed in Selling Opportunity or Bear Trap (5/16/14), the weakness following the false breakout of SP500 to 1902.17 on 5/13/14 indeed turned out to be a bear trap. This past week, stocks are making another attempt to make history, with SP500 coming within a single index point (1901.26) from a new high and the Dow Transports making a record high.

Potential selling opportunities are likely approaching. While bearish confirmations are absent, the downside potential is likely meaningful and attractive from a risk reward perspective.

Transports likely topping
Since its 2014 low, the Dow Transport Average may be tracing out two ending diagonal triangles at two wave degrees, as illustrated by the blue trend lines and red trend lines in Chart 1.


Chart 2 shows how near term development in Transports fit into the larger picture since the 2009 bottom. Several tracking counts place the transports at topping areas for a meaningful pullback. For example:

[1] a pullback to the base of the small EDT around 7521.18 is 6%
[2] a pullback towards 7009.98 associated with the bullish blue/pink count represents a 12% correction
[3] a pullback towards 6237.14 associated with the bullish blue count represents a 22% correction
[4] the bearish red count suggests a substantially deeper decline.

SP500 likely next 
SP500 is also poised to complete the overthrow of a potential ending diagonal triangle (Chart 3 and Chart 4).  Naturally, the upswing needs to finish its course.  However, transports could lead the pullback the same way as they had led the rally.

Tech and small caps
Tech (Chart 5) and small caps (Chart 6) show upside potential both in time and price, as observed last week. At the same time, one needs to monitor the potential for either a failed 5th wave rally or having topped in Q1 as these indexes have been lagging the general market.


Thursday, May 22, 2014

Market Timing Update (5/22/14)

[EOD] Stocks -
The Dow Transports made a fresh all-time high today, satisfying the minimum requirement of a potential EDT (Chart 1). SP500 is close to a new high before turning down into the close. Note that SP500 is also at the right shoulder of a potential HS pattern (Chart 2).

[715am] ES update -


Wednesday, May 21, 2014

Market Timing Update (5/21/14)

[EOD]Stocks-
SP500 made another attempt at breaking above the resistance zone, but price actions look tired. Let's see if the index can gap above resistance overnight. See chart.
The lower row of brackets shows potentially continued sideways actions if the larger symmetry plays out.
At the same time, a potential bearish head-and-shoulders pattern is developing. See the upper row of brackets.
Bullish tracking count (green) - (b)-down will eventually end or is already complete.
Bearish tracking count (red) - an ABC wave [ii]-up rebound is ending or is already complete.

[725am] ES Update-
FOMC minutes at 2pm.


Tuesday, May 20, 2014

Market Timing Update (5/20/14)

[EOD] Stocks-
SP500 reversed from an area of multiple resistance discussed yesterday, probing the MA50 for a 4th or 5th time over the past month, as well as the lower channel of the proposed EDT (Chart 1). Both lines held up, for now.

From a bullish perspective, it's best to shift the proposed wave (b) pullback to the right to accommodate an WXY correction (Chart 2, green).


[815am] ES update-


Monday, May 19, 2014

Market Timing Update (5/19/14)

[EOD] Stocks-
The Dow Transports made another marginal all-time high today while SP500 fought multiple resistance (Chart 1 red line and blue line and red count, Chart 2 fib and red count).


[720am] ES update-
ES probing potential support. See chart below and Selling Opportunity or Bear Trap (5/16/14) for discussion.