Monday, March 31, 2014

Market Timing Update (3/31/14)

[EOD] Stocks-
[720am] ES update-
Month end. Still tracking a new upswing, EDT-down, triangle. See charts below and see Monthly Outlook Update (3/28/14) for details.


Saturday, March 29, 2014

MTU Weekend Ed. - Monthly Outlook Update (3/28/14)

Stocks, bonds, USD, gold

Stocks
Stocks are likely to wrap up a month-long pullback (Chart 1) before a potential final upswing towards our “timed top” (Chart 2). Over the month, SP500, SP400 and Transports made all-time highs, unconfirmed by other indexes. A swift and strong upswing over the next two to three weeks would nicely achieve the “timed top”.

Bonds
The benchmark 10Y US Treasury yield has been consolidating in a potential bearish flag/triangle over the past month. A rally towards lower yields looks likely, perhaps to fill the gap around 2.3% on the 10Y as indicated in Chart 3.


USD
Last month, we observed that

(a) If the USD index rebounds from current levels, near term upside potential points to the 82-83 area before running into some long term resistance.

(b) At the same time, a potential head-and-shoulders pattern is emerging which points to a drop toward the 73 area if it materializes. A failed HS attempt likely introduces upside breakout potential for the USD index with respect to its long term resistance.

These observations remain the same. Moreover, the potential bearish head-and-shoulders pattern appears to be failing (Chart 4). An upswing to 82 or higher on the USD index appears likely.
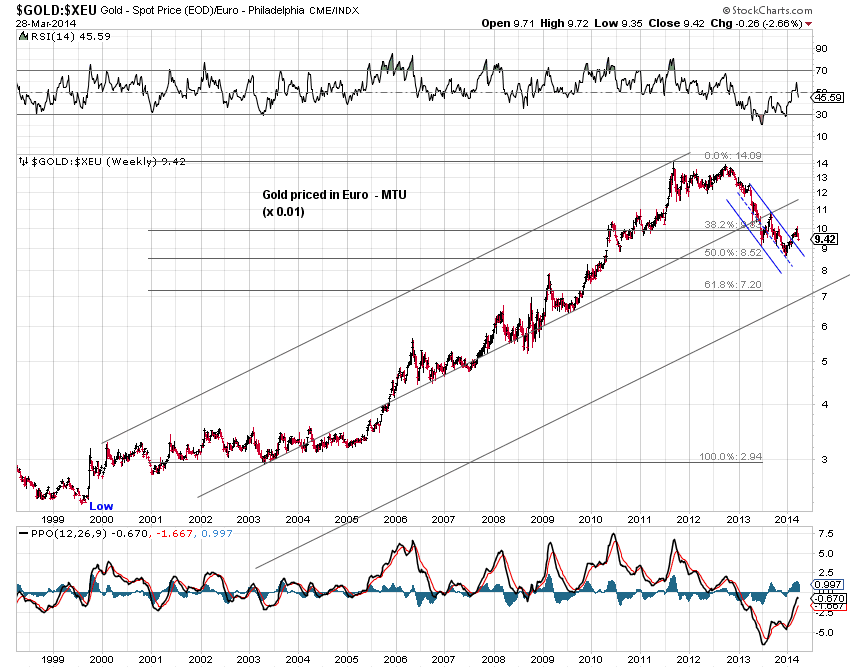

Gold
Gold priced in USD is now retesting prior resistance after breaking out earlier (Chart 5). Gold priced in JPY and EUR continue to show upside potential (Chart 6 and Chart 7), as discussed before. For the near term, a $100 drop in March, a 50% retrace and a potential bullish wedge (Chart 8) likely present an opportunity from a risk-reward perspective. Naturally, it’s important to adopt a stop at the 2013 low and risk-based position sizing.


Friday, March 28, 2014

Market Timing Update (3/28/14)

[715am] ES update -
Near term tracking, (1) corrective low in place (2) nearly finished flat-down with an EDT terminal wave (3) triangle in progress. See charts.


Thursday, March 27, 2014

Market Timing Update (3/27/14)

[EOD] Stocks -

[715am] ES update -
A retest of the neckline as discussed two days ago (Chart 1). Let's see if it holds. If not, a larger neckline looms below (Chart 2)


Wednesday, March 26, 2014

Market Timing Update (3/26/14)

[745am] ES update - Here we are again, approaching potential short term resistance. See charts.


Tuesday, March 25, 2014

Market Timing Update (3/25/14)

[EOD]Stocks -
[720am] ES update -
ES rebounded off trend line support (Chart 1). A retest of the neckline appears probable (Chart 2).


Monday, March 24, 2014

Market Timing Update (3/24/14)

[EOD] Stocks -
Wave B down was likely incomplete as of last Friday, given today's decline. See Posturing, T-(n-2) weeks (3/21/14) for details. See charts below on SPX and NDX.

[735am] ES update -


Sunday, March 23, 2014

MTU Weekend Ed. - Posturing, T-(n-2) weeks (3/21/14)

SP500 and SP400 made marginal all-time-highs at a quadruple witching session Friday.   The new highs were unconfirmed by other indexes. The speculated overthrow appears to be on track (Chart 1, blue).


Chart 2 shows an inverse head-and-shoulders pattern that points to 1910 in SP500, if Friday’s retest of the breakout turns out to be successful. Near term tracking counts offer several scenarios (Chart 2), including one that threatens the March low.

[green] Wave C-up began at the March low, which could morph into an ending diagonal triangle, especially when there are just a few weeks left to a potential “timed top”.

[red] Wave B-down is a multi-week triangle. Friday’s downswing was the first retrace of wave C-up.

[blue] Wave B-down is an expanded flat, which is still incomplete. Interestingly, there is a cluster of potential support around 1830 to 1835, including the 50-day moving average. It’s also possible for Wave B-down to morph into a sideways triangle if support turns out to be strong.

Friday, March 21, 2014

Market Timing Update (3/21/14)

[730am] ES update-
ES breaking out overnight. If successful, the IHS pattern points to the 1910-1915 area in June ES. See charts.


Thursday, March 20, 2014

Market Timing Update (3/20/14)

[EOD] Stock -
Today's rebound in stocks stalled at the IHS neckline (Chart 1 and 2), ahead of quadruple witching tomorrow. We are adding a potential bullish triangle to the tracking counts (Chart 1, purple). If this larger triangle plays out, its wave E may or may not be complete - one should allow room for a final (emotional) down swing. A higher high would suggest wave E ended at today's low, under this count. See charts.

[740am] ES update -
ES retesting the prior small wedge line (Chart 1). Chart 2 offers tracking counts and shows the one bullish HS pattern and one bearish IHS pattern discussed in yesterday's EOD update (on SPX cash). See charts.


Wednesday, March 19, 2014

Market Timing Update (3/19/14)

[EOD] Stocks
SP500 is retesting several key trend lines (Chart 1). We are looking at
-> a potential bearish Head-and-Shoulders pattern which points to the 1790 area, and counts as the red [iii]-down or blue (c)-down.
-> a potential bullish inverse HS pattern (Chart 1 and Chart 2) which points to the 1910 area, and counts as the green [iii]/[c] - up.


[725am] ES update-
While ES continues to trade up in the range (Chart 1), it's probable to see a retest of the breakout line in Chart 2.


Tuesday, March 18, 2014

Market Timing Update (3/18/14)

[EOD] Stocks -
SP400 is within points of a new high (Chart 1). Chart 2 offers near term tracking. See charts.

[1055am] Follow the Dow and Transports -
see charts.

[815am] ES update -
ES bounced off MA50 yesterday, retested the lower wedge line overnight, and is now inside the prior range. See daily chart 1. Chart 2 offers near term tracking counts.