Thursday, October 31, 2013

Market Timing Update (10/31/13)

[EOD] Stocks -

[115 pm] SPX update -
Month end. Tracking the blue and the green counts for the near term. See chart.


Wednesday, October 30, 2013

Tuesday, October 29, 2013

Market Timing Update (10/29/13)

[705am] ES update -
A cascade of potential triangles at increasingly smaller degrees in ES. See charts.


Monday, October 28, 2013

Market Timing Update (10/28/13)

[EOD] Stocks -
five wave up likely complete.

[810am] ES update -
One way to count a well-developed five-up in ES. See chart.


Saturday, October 26, 2013

MTU Weekend Ed. - New High (2) (10/25/13 close)

Stocks continue to push higher but are showing signs of fatigue. SP500 improved upon its prior all-time high of 1745.31 and reached 1759.82 (which is 14.5 index points or 0.83% higher).

SP500 is likely in wave five of a five-wave advance from the October low (Chart 1). The minimum requirement of a completed impulse has now been met (Chart 2). Early next week, SP500 is likely to conclude wave five, or wave one of wave five if wave five extends. Expect a consolidation or a larger degree reversal to follow.


While SP500 has broken above the 2000-2007 resistance line, it is now approaching the upper trend line of the Hope Rally (Chart 3). Resistance along this upper trend line is likely as the corrections in 2010, 2011 and 2013 suggest. We will update wave count details on the Hope Rally in our monthly outlook update next week.

Market internals are also less impressive than price advances. SP500 cumulative advance-decline line is lagging the index itself. See Chart 4.


Friday, October 25, 2013

Market Timing Update (10/25/13)

[8am] ES update -
potential triangle in ES, not so in SPX cash. see chart.


Monday, October 21, 2013

Market Timing Update (10/21/13)

[820 am] ES update -
Near term tracking from the low in ES - A-B triangle-C (red) and 1-2-3 (blue). See chart.


Saturday, October 19, 2013

MTU Weekend Ed. - New High (10/18/13)

An 11th-hour temporary deal on budget funding and debt ceiling allows the U.S. government to resume spending and taking on additional debt, immediately. The market cheered as October options expire and a full moon rise. SP500 did not disappoint (see Showdown (10/11/13)), making a new all time high of 1745.31.

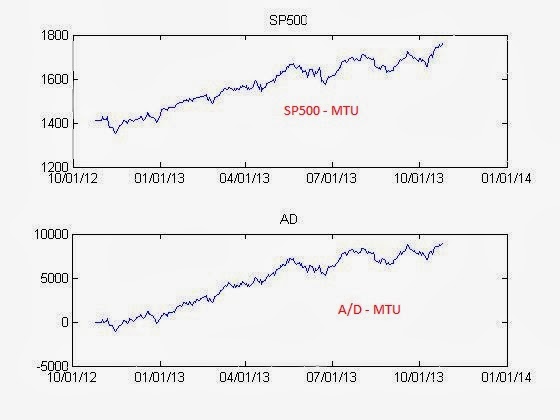
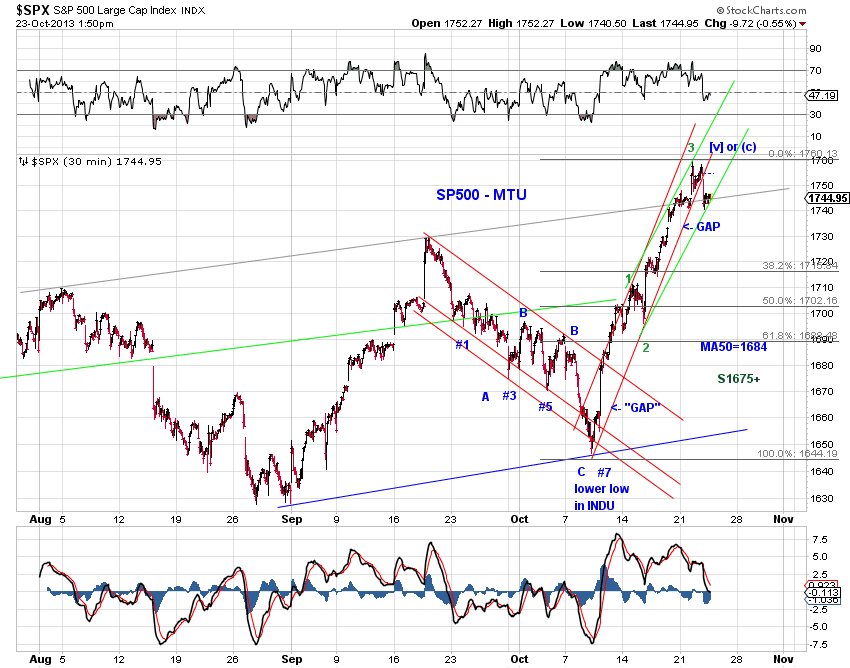
For the near term, we track SP500 as either finishing the impulse off the October low or somewhere in wave three of the proposed impulse (Chart 1).   Odds appear to favor the former as SP500 is showing negative divergence with its advance-decline lines (Chart 2), among other developments.  Closing the gap around 1735 next week likely indicate a retrace of the relief rally is in progress.


Taking into account of the recent price action, we identify the following top long term tracking scenarios.

[complex double three, Chart 3] SP500 is finishing up the final wave (c) of [Y] as indicated.

[123, Chart 4 green] The October low is (4)-down of [3]-up. Alternatively, the October low is [ii]-down of 5-up of (3)-up of [3]-up.

[ABC, Chart 4, red] The pending larger degree high is wave [C]-up of a larger [A][B][C] structure since the 2009 low.


Thursday, October 17, 2013

Market Timing Update (10/17/13)

[EOD] Stocks -
U.S. government reopens for business and spending. SP500 makes a new all time high. Full moon tomorrow.

For the near term, SP500 is likely completing a five-wave advance from the October low (Chart 1 and Chart 2). With respect to the larger picture, the pending high likely counts as the final wave (c) (Chart 3) or wave 1 of (5)-up of [3]or [C](Chart 4).


Wednesday, October 16, 2013

Market Timing Update (10/16/13)

[EOD] Stocks -
Tracking the 11th-hour-deal-driven rally as either a new leg up (Chart, blue) or an extended small-degree 5th wave (Chart, red). While odds favor a new high in SP500, the likelihood of the market selling the news of an actual deal is also non-negligible.
[1145am] SPX update -


[805am] ES update -
Day 16. Full moon approaching. Tracking three counts in ES from the recent low. See chart.

[blue] Expect a post triangle thrust up, potentially fueled by a (partial) resolution of funding and debt ceiling deals. 20 to 40 points potential.

[green] Expect a flat like retrace. Wave(C)-down is likely in progress.

[red] A failed/truncated impulse was complete at the recent high. LD-1 down yesterday and 2-up overnight.