Stocks, Bonds, Dollar, Gold
Stocks
SP500 shows potential of a pullback/reversal based on a five-wave decline from its nominal all time high just under 1700 (
Chart 1). Friday's strong rebound in SP500 and the Dow and a mere potential leading diagonal triangle decline in the Dow (
Chart 2) from its nominal high introduce reasonable doubt on the bearish view. However, the much weaker rebound in mid- and small(er)-cap indexes reveals potential underlying weakness.
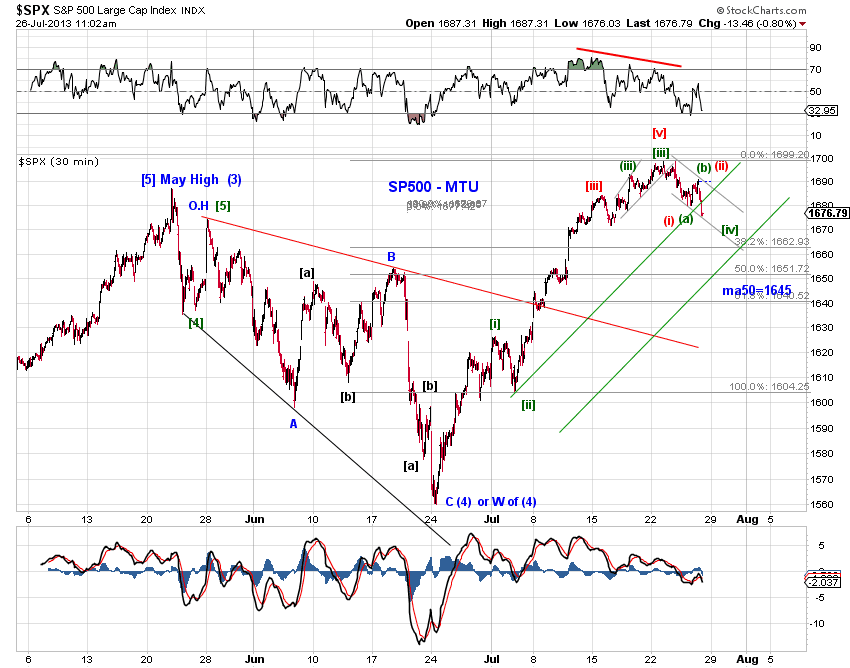
In any case, the pullback from recent highs could be a small degree fourth wave off the June low (
Chart 3) or something more bearish. Also note the potential head-and-shoulders top in
Chart 3.
With respect to the more bearish potential,the best candidate counts are
[1] A completed double zigzag since the 2009 low (
Chart 4 blue)
[2] Wave 4-down of (3) of [3]-up of a bull market count since the 2009 low (
Chart 5 green)
[3] wave C of an expanded flat/triangle from the May high, or wave two retrace of the advance since the June low.
Bonds
Chart 6 presents two long term tracking counts on the 10Y UST yield index as discussed previously.
Based on the green count, the multi-decade bull market in bonds ended in 2012 at the conclusion of an EDT dating back to Y2K.
However, the blue count suggests a smaller degree EDT dating back to 2007 that is still in progress. Expect a new low in yields and new high in price.
Chart 7 offers a closer look at the wave structures in 10Y yields since the 2012 low.
Dollar
July was a down-month for the USD index. We may have seen the 2013 high for the USD index based on two of our top three long term tracking counts (
Chart 8 blue and green).
Chart 9 updates our tracking counts since the 2011 low in USD.
Gold
As discussed before, we have been tracking gold with a fourth wave pullback since its 2011 top.
Potential targets for the low are the June low, 1150, 1125, 970.
The strong rebound since the June low allows us to eliminate one of the three near term tracking counts. June's low being wave [iii] of an extended wave 5 of (C) is invalidated (see
blue count in this chart). That left us with the following two near term tracking counts for the June low:
[red] wave 3 of (C). This count suggests that the recent rebound in Gold is a wave 4. A retest of the June low, potentially to 1150, is likely.
[blue] wave 5 of (C) out of a triangle. This count indicates that Gold has bottomed in June.
Chart 10 updates and shows the overhead channel resistance.
Chart 11 tracks a well-channeled rise in Gold prices off the June low.
 poised to roll over again.


