Friday, March 29, 2013

Monthly Outlook Update (3/28/13 Close)

Stocks -
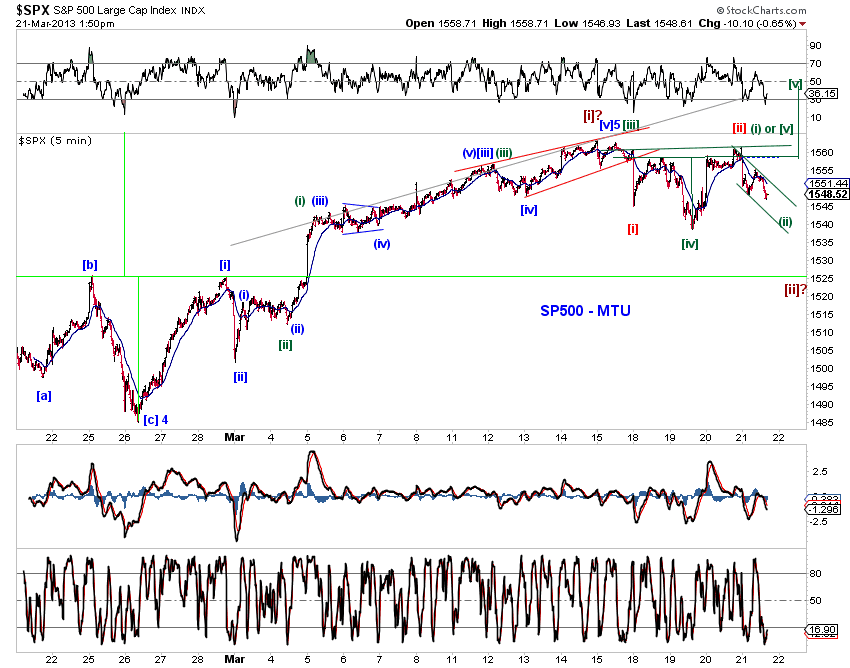
The upswing since the November 2012 low is likely approaching its end (Chart 1, blue). The top near term bullish alternative would be a small-degree 3rd wave extension (Chart 1, green) or 5th wave extension (Chart 1, red) which at this point is far from certain.

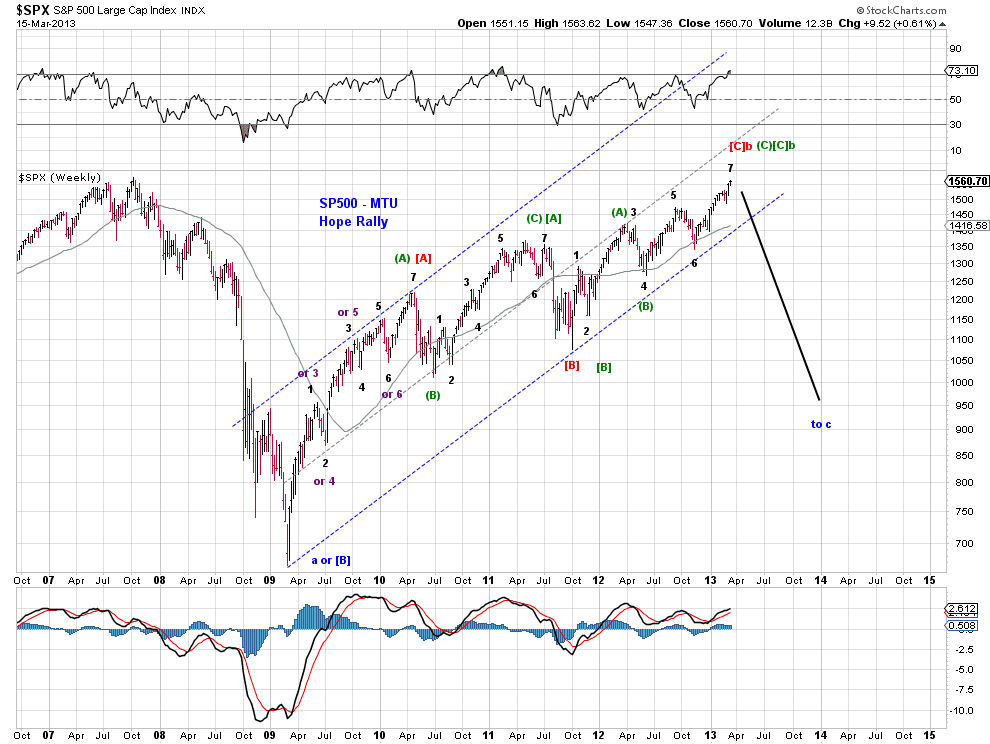
From a long term perspective, the pending top has the potential to complete the upswings at several degrees, potentially the Hope Rally itself. The best bullish alternative scenario since the 2009 bottom is an ending diagonal triangle (Chart 2). See A View from a Top (3/15/13) for details.


Bonds -
Treasuries sold off in early March but recovered all their losses by the end of the Month (Chart 3). The profile of the upswing in 10Y yields since their multi-decade-low in 2012 remains corrective and well contained by a base channel. Until bond yields breakout, the potential for one more rally (Chart 4) deserves proper consideration.


USD -
The USD index is attempting to breakout to the upside (Chart 5), but upside momentum is waning and bearish divergence has surfaced (Chart 6).  A near term retrace (Chart 6, blue) or an outright reversal (Chart 6, red) is not out of the question.

The proposed range-bound profile for USD continues to track. Larger degree tracking counts for the 70-90 range in Chart 5 are still on the table.


Gold -
The proposed wave [4] correction in Gold (priced in USD) continues to track. Gold prices have attempted to defend their 2012 trend line support over the past month (Chart 7).

Prices remain just above the near term "line in the sand." A decisive breach of current support level would suggest a measured target around $1300, which is well within the normal range of wave [4] and also represents a Fib-382 retrace of the prior wave [3] advance (Chart 8).

The proposed wave [4] has now reached parity with wave [2] in time (Chart 8), which is potentially bullish. However, a still shallow retrace and the potential for wave [4] to consume more time based on the tendency for alternation continue to suggest patience and caution when one attempts to capture the pending wave [5]-up.


Wednesday, March 27, 2013

Market Timing Update (3/27/13)

[EOD] Stocks -


[805am] ES update -
Full moon. Let's see if a potential triangle holds or fails (green).


Tuesday, March 26, 2013

Market Timing Update (3/26/13)

[EOD] Stock -
Note the potential fractal if the market turns down from here.


[8am] ES update -


Friday, March 22, 2013

MTU Weekend Ed. - Short Term Update (3/22/13 close)


There's no change to our view discussed in A View from a Top (3/15/13).   Chart 1 updates the 60-min chart on SP-500 and Chart 2 highlights a number of tracking counts for the proposed final subdivision of the upswing since the November low. 

The most bearish count is a truncated small-degree 5th wave in SPX  (Chart 2, red count).  Note that there is no truncation in the Dow, transports and SP400 under this interpretation, satisfying the minimum requirement of a higher high.  Of course, this small-degree 5th wave could extend into a regular impulse wave or an EDT as illustrated in the chart.

Bullish counts in Chart 2 are built on various potential points where wave [iv] could (have) completed. The proposed wave [v] (of 5) would push the market to a moderate new high.


Market Timing Update (3/22/13)

[820am] ES update -
see yesterday's update for details on these tracking counts.


Thursday, March 21, 2013

Market Timing Update (3/21/13)

[150 pm] ES/ SPX update -
color coded tracking counts.  On ES, 
[bearish black] 5-up is done.  Needs a hard [iii]-down
[bullish green] interesting potential for an EDT or better.
[bullish blue] 5-up is extending, needs (c)-down  to finish [ii]-down.


[940 am] SPX update -


[740 am] ES update -


Wednesday, March 20, 2013

Market Timing Update (3/20/13)

[335pm] SPX/ES update -
see charts.


[750am] ES update -
Bearish count - a flat [ii]/[b] in ES (and an expanded flat in SPX) as discussed yesterday
Bullish count - a small degree 5th wave or a 3rd wave at one larger degree is in progress as discussed yesterday.
See chart.


Tuesday, March 19, 2013

Market Timing Update (3/19/13)

[EOD] Stocks -
Chart 1 tracks near term squiggles.
Key bullish count (green) suggests today's low is a small-degree wave [iv].
Key bearish count (red) tracks an expanded flat wave [ii]-up in SPX and a flat wave [ii]-up in ES.
The alt-red counts tracks a potential LDT wave [i]-down. This is the alt-bearish count as it is less in sync with ES.
Chart 2 tracks the larger advance since the November low.


Monday, March 18, 2013

Market Timing Update (3/18/13)

[EOD] Stocks -
See charts and also see A View from a Top (3/15/13) for discussions.


[8am] ES update -
See charts and also see A View from a Top (3/15/13) for discussions.


Sunday, March 17, 2013

MTU Weekend Ed. - A View from a Top (3/15/13)


One reason why SP500 is so far unable to make a new all time high is the mega-caps which are still 4.6% below their 2007 high.  A near term top is approaching, which also has the potential to mark a top at several larger degrees.  We also discuss the best bullish count at larger degrees.   

SP500 internals - mega caps lagging
At its recent high, SP500 is only about 13 index points away from its all-time high. The majority of leading benchmark indexes have now exceeded their 2007 peaks. It’s reasonable to expect that SP500 is making and will make an attempt at a new high. However, whether SP500 makes a new high is less relevant in the context of a potential b-wave top (New All Time High (3/8/13)).

However, it is interesting to note that it is the mega-caps that are holding SP500 back from its all time high. Chart 1 shows that SP500 is now at the high end of its trading range and VIX at the low end of its trading range dating back to year 2000 and more. The equal-weight SP500 index is already 14.5% above its 2007 peak driven by lower-cap constituents. SP400 mid-cap index, which has been historically strong in upswings, is 23% above its 2007 peak. However, SP100 mega-cap index, which have lagged in 2007, is still 4.6% away from its prior top.


Near term top approaching
We observed in New All Time High (3/8/13) that, "Regardless the larger count, a five-wave advance since the November 2012 low is approaching its end. A partial or more likely full retrace is likely to follow."

This past week’s market action continues to support this scenario. As Chart 2 on SP500 and Chart 3 on DJ Transportation Average show, the proposed five-wave advance is looking increasingly mature. So one simply waits for its conclusion.


A potential top at several larger degrees
The pending high has the potential to mark a top at several larger degrees
[1] It concludes a regular five-wave advance since the November 2012 low as Chart 2 illustrates.
[2] It potentially completes an overlapping 7 wave advance since the 2011 low, in the form of a double zigzag (Chart 4).
[3] It potentially terminates the Hope Rally since the 2009 low in the form a triple-three or a double-three (Chart 5).


The best bullish count at larger degrees

We also observed in New All Time High (3/8/13) that, "A bullish interpretation would label the rally since 2009 as a nascent supercycle-degree wave (V) advance.  However, wave structures associated with the rally to date are far from convincing.  Other than the potential of a set of nested 1st and 2nd waves, wave structures over the past four years does not describe an impulse wave. Time will tell."

That observation leaves us with a potential (leading or ending) diagonal triangle as the best bullish alternative count for the Hope Rally.  Chart 6 illustrates.

A bearish EDT would potentially serve as primary wave [C] of cycle wave b,  OR supercycle wave (V) all together.   See long-term charts in New All Time High (3/8/13) for these larger waves.

A bullish LDT would potentially serve as cycle wave I of supercycle wave (V).

Regardless of the larger wave interpretation, the pending high is likely wave (C) of the proposed diagonal triangle (Chart 6, black) or to a lesser extent, its entirety (Chart 6, red).  A full or near full retrace of the advance since November is likely.  The personality of the proposed decline will shed light on the larger count.