Chart 1 on the SP500 cash index highlight the top two near term counts, one bullish and one bearish (ED). The famous triangle is either wave [iv] or wave B in both counts. The difference lies with the structure of the post-triangle thrust.
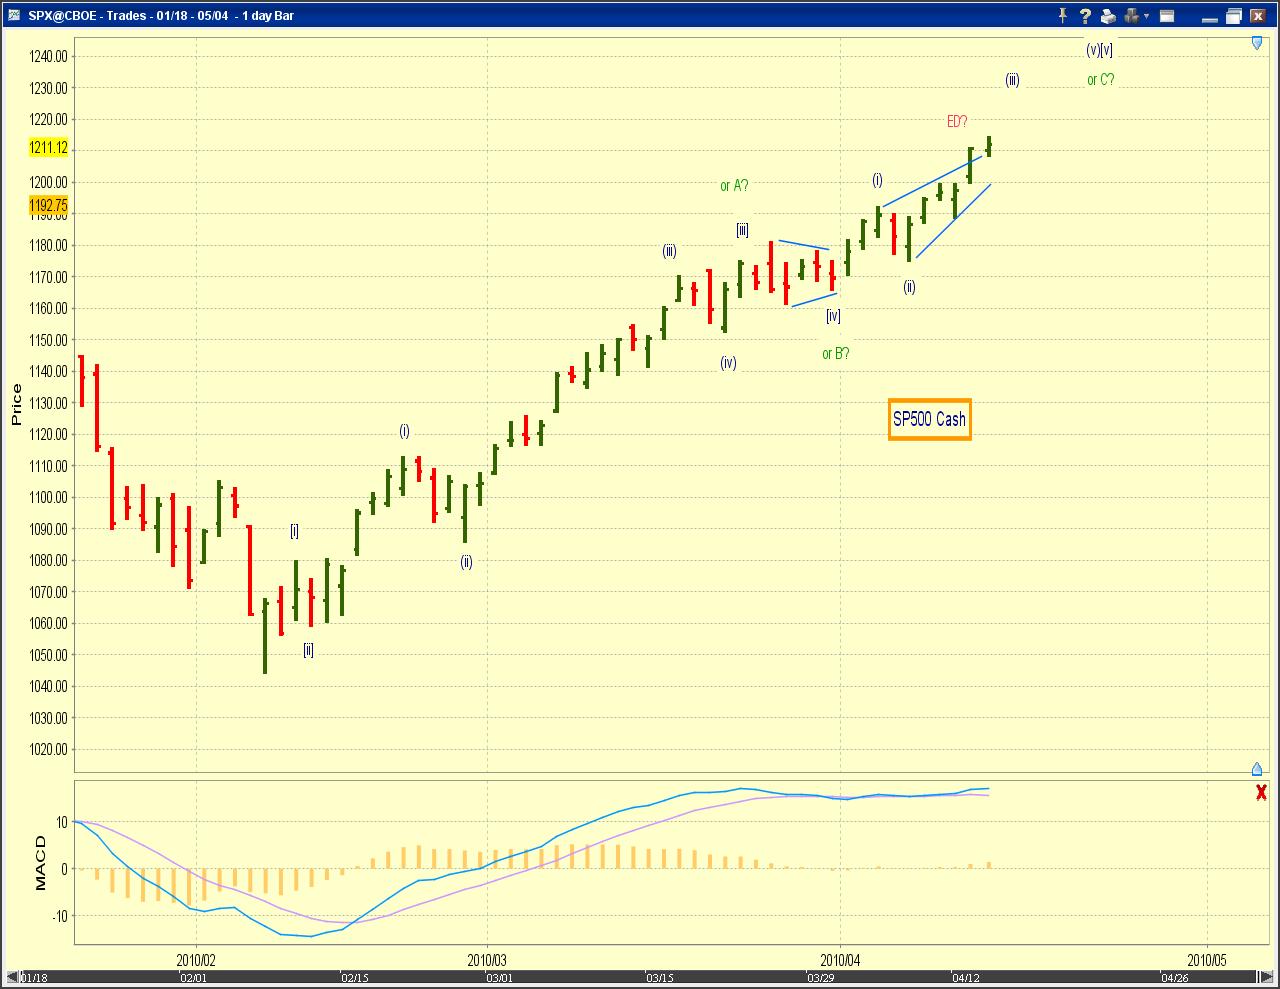

The bullish count has a regular (and extended) five post triangle. The squiggle count places today's high near iii of (iii). There should be more upside potential near term under this interpretation. This count is also more in sync with that in the RUT.
 The bearish count has a contracting ED post triangle (Chart 2). Note that today's high could be the top as we may have a truncated small-degree fifth wave as the end of c of (v)[v] this afternoon (Chart 3). Alternatively [4] of c of (v)[v] may be still in progress - potentially another small triangle? - as also indicated in Chart 3.
No comments:
Post a Comment